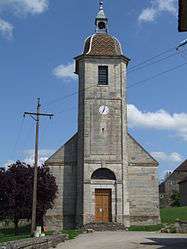
Chevigny
| Chevigny | |
|---|---|
 | |
 Chevigny | |
|
Location within Bourgogne-Franche-Comté region 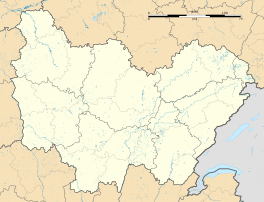 Chevigny | |
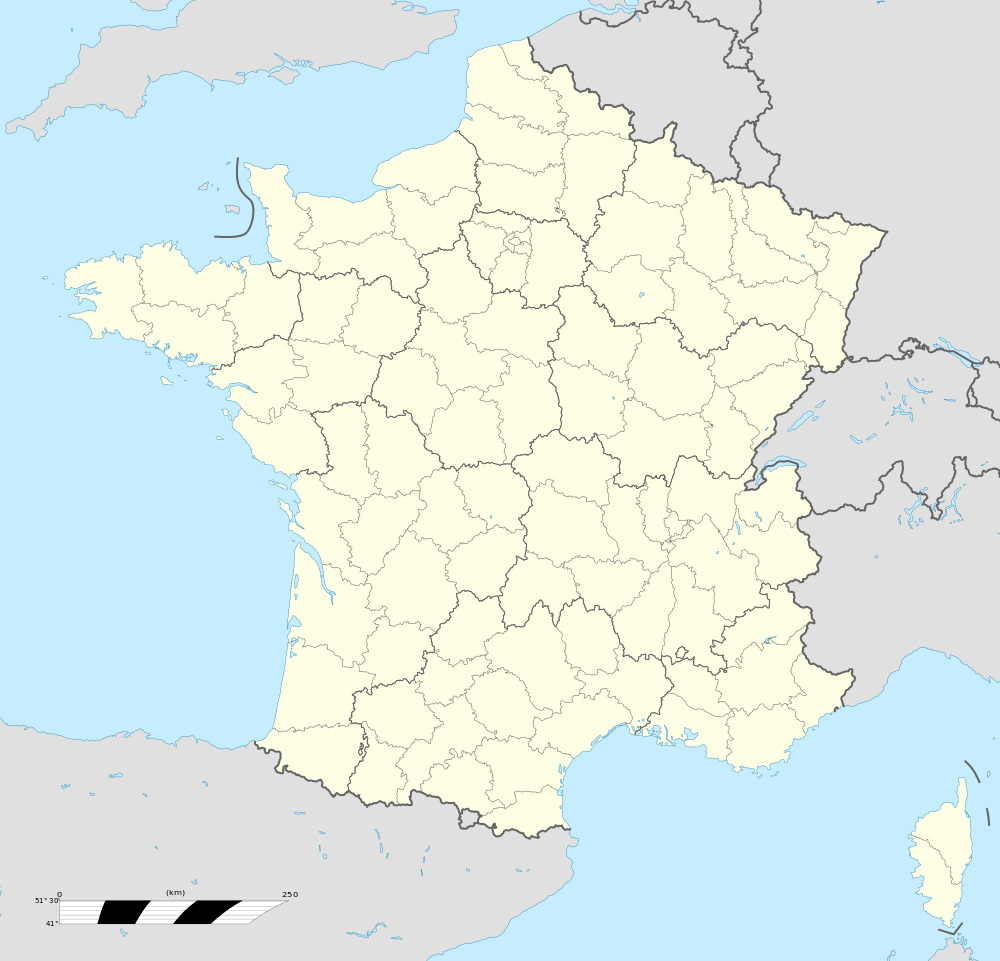
| Coordinates: 47°10′39″N 5°28′34″E / 47.1775°N 5.4761°ECoordinates: 47°10′39″N 5°28′34″E / 47.1775°N 5.4761°E | |
| Country | France |
| Region | Bourgogne-Franche-Comté |
| Department | Jura |
| Arrondissement | Dole |
| Canton | Montmirey-le-Château |
| Government | |
| • Mayor (2014–2020) | Robert Forêt |
| Area1 | 7.67 km2 (2.96 sq mi) |
| Population (2012)2 | 284 |
| • Density | 37/km2 (96/sq mi) |
| Time zone | CET (UTC+1) |
| • Summer (DST) | CEST (UTC+2) |
| INSEE/Postal code | 39141 / 39290 |
| Elevation | 192–295 m (630–968 ft) |
|
1 French Land Register data, which excludes lakes, ponds, glaciers > 1 km² (0.386 sq mi or 247 acres) and river estuaries. 2 Population without double counting: residents of multiple communes (e.g., students and military personnel) only counted once. | |
Chevigny is a commune in the Jura department in Franche-Comté in eastern France.
Population
| Historical population | ||
|---|---|---|
| Year | Pop. | ±% |
| 1793 | 534 | — |
| 1806 | 561 | +5.1% |
| 1821 | 527 | −6.1% |
| 1831 | 616 | +16.9% |
| 1841 | 618 | +0.3% |
| 1851 | 589 | −4.7% |
| 1861 | 502 | −14.8% |
| 1872 | 434 | −13.5% |
| 1881 | 416 | −4.1% |
| 1891 | 405 | −2.6% |
| 1901 | 328 | −19.0% |
| 1911 | 304 | −7.3% |
| 1921 | 271 | −10.9% |
| 1931 | 225 | −17.0% |
| 1946 | 179 | −20.4% |
| 1954 | 181 | +1.1% |
| 1962 | 176 | −2.8% |
| 1968 | 173 | −1.7% |
| 1975 | 190 | +9.8% |
| 1982 | 192 | +1.1% |
| 1990 | 198 | +3.1% |
| 1999 | 214 | +8.1% |
| 2006 | 265 | +23.8% |
| 2012 | 284 | +7.2% |
See also
References
| Wikimedia Commons has media related to Chevigny (Jura). |
This article is issued from Wikipedia - version of the 3/15/2016. The text is available under the Creative Commons Attribution/Share Alike but additional terms may apply for the media files.