Sajóvámos
| Sajóvámos | ||
|---|---|---|
| Village | ||
| ||
| Country |
| |
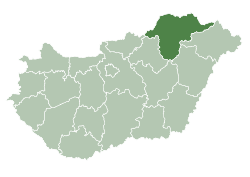
| Regions | Northern Hungary | |
| County | Borsod-Abaúj-Zemplén County | |
| Area | ||
| • Total | 31.22 km2 (12.05 sq mi) | |
| Population (2013) | ||
| • Total | 2,176 | |
| • Density | 70/km2 (180/sq mi) | |
| Time zone | CET (UTC+1) | |
| • Summer (DST) | CEST (UTC+2) | |
| Website | sajovamos.hu | |

Sajóvámos is a village in Borsod-Abaúj-Zemplén County in northeastern Hungary.[1]
.jpg)
Calvinism church in Sajóvámos
Ethnic groups
In 2011 Census[2]
| Group | Population (2011) | Proportion |
|---|---|---|
| Hungarians | 2033 | 93 % |
| Gypsies | 18 | 1 % |
| Germans | 15 | 1 % |
| Others or no answer | 119 | 5 % |
| Sajóvámos | 2185 | 100 % |
| Historical population | ||
|---|---|---|
| Year | Pop. | ±% |
| 1996 | 2,226 | — |
| 1997 | 2,241 | +0.7% |
| 1998 | 2,225 | −0.7% |
| 1999 | 2,195 | −1.3% |
| 2000 | 2,198 | +0.1% |
| 2001 | 2,246 | +2.2% |
| 2002 | 2,243 | −0.1% |
| 2003 | 2,250 | +0.3% |
| 2004 | 2,303 | +2.4% |
| 2005 | 2,294 | −0.4% |
| 2006 | 2,266 | −1.2% |
| 2007 | 2,279 | +0.6% |
| 2008 | 2,256 | −1.0% |
| 2009 | 2,247 | −0.4% |
| 2010 | 2,227 | −0.9% |
| 2011 | 2,186 | −1.8% |
| 2012 | 2,187 | +0.0% |
| 2013 | 2,176 | −0.5% |
Population pyramid
Estimate data from 2011 (population:2213)
- 0–14 years: 414 people = 18.7%

- 15–60 years: 1487 people = 67.2%

- 60 years or older: 312 people = 14.1%
References
 |
|
|
|
|
| |
|
| ||
| ||||
| | ||||
| |
|
|
Coordinates: 48°11′N 20°51′E / 48.183°N 20.850°E
This article is issued from Wikipedia - version of the 1/24/2016. The text is available under the Creative Commons Attribution/Share Alike but additional terms may apply for the media files.