Pinamungajan
| Pinamungajan | |
|---|---|
| Municipality | |
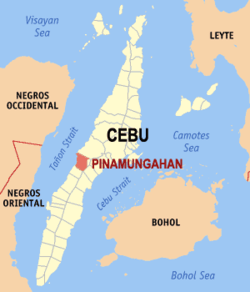 Map of Cebu with Pinamungajan highlighted | |
.svg.png) Pinamungajan Location within the Philippines | |
| Coordinates: 10°16′N 123°35′E / 10.27°N 123.58°ECoordinates: 10°16′N 123°35′E / 10.27°N 123.58°E | |
| Country | Philippines |
| Region | Central Visayas (Region VII) |
| Province | Cebu |
| District | 3rd district of Cebu |
| Established | 1815 |
| Barangay | 26 (see § Barangays) |
| Government [1] | |
| • Type | Sangguniang Bayan |
| • Mayor | Glenn Baricuatro (1‑Cebu) |
| • Vice mayor | Ma Honeylette Lingad |
| • Town Council |
Members
|
| • Representative | Gwendolyn Garcia |
| Area[2] | |
| • Total | 109.16 km2 (42.15 sq mi) |
| Population (2015 census)[3] | |
| • Total | 65,955 |
| • Density | 600/km2 (1,600/sq mi) |
| • Voter (2016)[4] | 40,737 |
| Time zone | PHT (UTC+8) |
| ZIP code | 6039 |
| IDD : area code | +63 (0)32 |
| Income class | 2nd class |
| PSGC | 072237000 |
| Website |
pinamungajan |
Pinamungajan (also Pinamungahan) is a 2nd municipal income class municipality in the province of Cebu, Philippines.[2] According to the 2015 census, it has a population of 65,955.[3] In the 2016 election, it had 40,737 registered voters.[4]
The municipality was established in the 1815 under the Spanish colonial government in the country. The municipality got its name from the diligent and hardworking people, working hand-in-hand especially during the agricultural harvest season – "Pinamungajan", which originated from the Visayan word pinamuhuan, meant a worker share for his effort during a farm harvest. Over time the Pinamuhuan eventually changed to the current name of the municipality.
Barangays
Pinamungajan comprises 26 barangays:[2]
| PSGC | Barangay | Population | ±% p.a. | ||
|---|---|---|---|---|---|
| 2015[3] | 2010[5] | ||||
| 072237001 | Anislag | 2.4% | 1,597 | 1,434 | +2.07% |
| 072237002 | Anopog | 5.8% | 3,797 | 3,116 | +3.84% |
| 072237003 | Binabag | 3.2% | 2,142 | 2,032 | +1.01% |
| 072237004 | Buhingtubig | 2.7% | 1,763 | 1,691 | +0.80% |
| 072237005 | Busay | 1.7% | 1,117 | 1,128 | −0.19% |
| 072237006 | Butong | 3.1% | 2,035 | 1,848 | +1.85% |
| 072237007 | Cabiangon | 1.5% | 1,000 | 891 | +2.22% |
| 072237008 | Camugao | 3.1% | 2,048 | 2,007 | +0.39% |
| 072237009 | Duangan | 2.1% | 1,400 | 1,264 | +1.96% |
| 072237010 | Guimbawian | 2.9% | 1,894 | 1,698 | +2.10% |
| 072237011 | Lamac | 9.0% | 5,953 | 4,470 | +5.61% |
| 072237012 | Lut‑od | 4.7% | 3,112 | 2,213 | +6.71% |
| 072237013 | Mangoto | 3.9% | 2,602 | 2,172 | +3.50% |
| 072237014 | Opao | 0.8% | 503 | 511 | −0.30% |
| 072237015 | Pandacan | 8.9% | 5,890 | 5,291 | +2.06% |
| 072237016 | Poblacion | 10.2% | 6,754 | 5,925 | +2.52% |
| 072237017 | Punod | 2.7% | 1,781 | 1,870 | −0.92% |
| 072237018 | Rizal | 3.7% | 2,418 | 2,341 | +0.62% |
| 072237019 | Sacsac | 2.3% | 1,533 | 1,415 | +1.54% |
| 072237020 | Sambagon | 1.9% | 1,233 | 1,074 | +2.66% |
| 072237021 | Sibago | 3.4% | 2,261 | 1,830 | +4.11% |
| 072237022 | Tajao | 10.5% | 6,915 | 5,648 | +3.93% |
| 072237023 | Tangub | 1.3% | 880 | 1,000 | −2.40% |
| 072237024 | Tanibag | 3.0% | 2,002 | 1,686 | +3.32% |
| 072237025 | Tupas | 1.3% | 864 | 817 | +1.07% |
| 072237026 | Tutay | 3.7% | 2,461 | 2,625 | −1.22% |
| Total | 65,955 | 57,997 | +2.48% | ||
Demographics
| Population census of Pinamungajan | |||||||||||||||||||||||||
|---|---|---|---|---|---|---|---|---|---|---|---|---|---|---|---|---|---|---|---|---|---|---|---|---|---|
|
| ||||||||||||||||||||||||
| Source: Philippine Statistics Office[3][5][6] | |||||||||||||||||||||||||
In the 2016 election, it had 40,737 registered voters, meaning that 62% of the population are aged 18 and over.[4]
Tourist Attractions
- Campolabo Sandbar
- Hidden Valley Wave Pool Resort
- Odlom Falls
- Sinungkulan Cave
- Sinungkulan Falls
References
- ↑ "Municipality". Quezon City, Philippines: Department of the Interior and Local Government. Retrieved 31 May 2013.
- 1 2 3 "Municipal: Pinamungajan". PSGC Interactive. Quezon City, Philippines: Philippine Statistics Authority. Retrieved 8 January 2016.
- 1 2 3 4 "Region VII (CENTRAL VISAYAS)". Census of Population (2015): Total Population by Province, City, Municipality and Barangay (Report). PSA. Retrieved 20 June 2016.
- 1 2 3 "2016 National and Local Elections Statistics". Commission on Elections. 2016.
- 1 2 "Region VII (CENTRAL VISAYAS)". Census of Population and Housing (2010): Total Population by Province, City, Municipality and Barangay (Report). NSO. Retrieved 29 June 2016.
- ↑ "Region VII (CENTRAL VISAYAS)". Census of Population (1995, 2000 and 2007): Total Population by Province, City and Municipality (Report). NSO. Archived from the original on 24 June 2011.
External links
 |
Toledo | | ||
| Tañon Strait | |
Naga San Fernando | ||
| ||||
| | ||||
| Aloguinsan | Carcar |
Cebu City (capital) | |
| Municipalities |
|
| Component cities | |
| Highly urbanized cities | (Administratively independent from the province but grouped under Cebu by the Philippine Statistics Authority. Mandaue is grouped under the 6th legislative district of Cebu but still independent from the province.) |