Dutch general election, 1982
Dutch general election, 1982

|
|
|
|
All 150 seats to the House of Representatives
76 seats were needed for a majority |
| Turnout |
81.0% |
| |
First party |
Second party |
Third party |
| |
 |
 |
 |
| Leader |
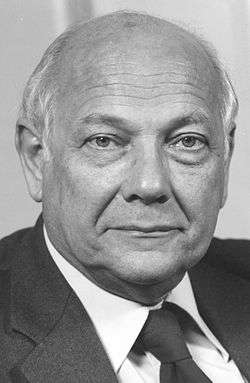
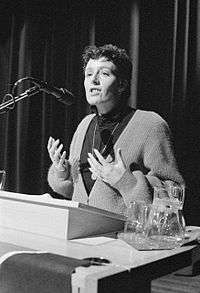
Joop den Uyl |
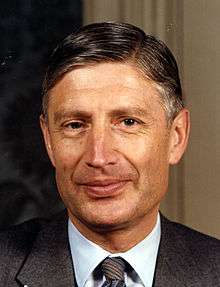
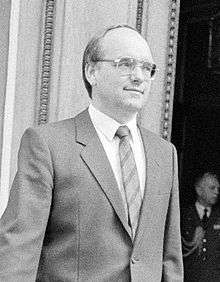
Dries van Agt |
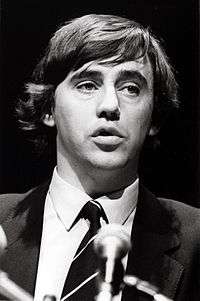
Ed Nijpels |
| Party |
PvdA |
CDA |
VVD |
| Leader since |
1966 |
1976 |
1982 |
| Last election |
44 seats, 28.3% |
48 seats, 30.8% |
26 seats, 17.3% |
| Seats won |
47 |
45 |
36 |
| Seat change |
 3 3 |
 3 3 |
10 |
| Popular vote |
2,420,441 |
2,503,517 |
1,900,763 |
| Percentage |
30.4% |
29.4% |
23.1% |
|
| |
Fourth party |
Fifth party |
Sixth party |
| |
 |
 |
 |
| Leader |
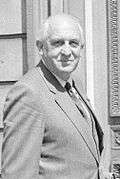
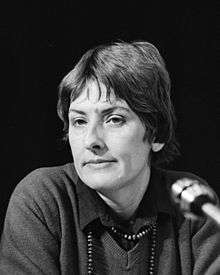
Jan Terlouw |
Fred van der Spek |
Henk van Rossum |
| Party |
D66 |
PSP |
SGP |
| Leader since |
1973 |
1978 |
1981 |
| Last election |
17 seats, 11.1% |
3 seats, 2.1% |
3 seats, 2.0% |
| Seats won |
6 |
3 |
3 |
| Seat change |
11 |
 0 0 |
0 |
| Popular vote |
351,278 |
187,547 |
156,636 |
| Percentage |
4.3% |
2.3% |
1.9% |
|
| |
Seventh party |
Eighth party |
Ninth party |
| |
 |
 |
 |
| Leader |
Ina Brouwer |
Ria Beckers |
Meindert Leerling |
| Party |
CPN |
PPR |
RPF |
| Leader since |
1982 |
1977 |
1980 |
| Last election |
3 seats, 2.0% |
3 seats, 2.0% |
2 seats, 1.2% |
| Seats won |
3 |
2 |
2 |
| Seat change |
0 |
1 |
0 |
| Popular vote |
147,753 |
136,446 |
124,235 |
| Percentage |
1.8% |
1.5% |
1.5% |
|
|
|
|
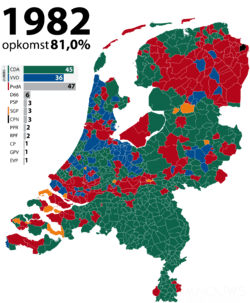
Early general elections were held in the Netherlands on 8 September 1982.[1] The Labour Party emerged as the largest party, winning 47 of the 150 seats in the House of Representatives.[2]
Results
| Party |
Votes |
% |
Seats |
+/– |
|---|
| Labour Party | 2,503,517 | 30.4 | 47 | +3 |
| Christian Democratic Appeal | 2,420,441 | 29.4 | 45 | –3 |
| People's Party for Freedom and Democracy | 1,900,763 | 23.1 | 36 | +10 |
| Democrats 66 | 351,278 | 4.3 | 6 | –11 |
| Pacifist Socialist Party | 187,547 | 2.3 | 3 | 0 |
| Reformed Political Party | 156,636 | 1.9 | 3 | 0 |
| Communist Party of the Netherlands | 147,753 | 1.8 | 3 | 0 |
| Political Party of Radicals | 136,446 | 1.7 | 2 | –1 |
| Reformatory Political Federation | 124,235 | 1.5 | 2 | 0 |
| Reformed Political League | 67,163 | 0.8 | 1 | 0 |
| Centre Party | 68,423 | 0.8 | 1 | +1 |
| Evangelical People's Party | 56,466 | 0.7 | 1 | +1 |
| Democratic Socialists '70 | 115,598 | 1.4 | 0 | 0 |
| God with Us | 0 | 0 |
| Small Party | 0 | 0 |
| Dutch Peoples-Union | 0 | 0 |
| Progressive Party for the Preservation of Work, Environment and Society | 0 | New |
| Roman Catholic Party of the Netherlands | 0 | 0 |
| Right-wing People's Party | 0 | 0 |
| Socialist Party | 0 | 0 |
| Invalid/blank votes | 37,115 | – | – | – |
| Total | 8,732,631 | 100 | 150 | 0 |
| Registered voters/turnout | 10,216,627 | 81.0 | – | – |
| Source: Nohlen & Stöver |
| Popular Vote |
|---|
|
|
|
|
|
| PvdA |
|
30.40% |
| CDA |
|
29.39% |
| VVD |
|
23.08% |
| D66 |
|
4.26% |
| PSP |
|
2.28% |
| SGP |
|
1.90% |
| CPN |
|
1.79% |
| PPR |
|
1.66% |
| RPF |
|
1.51% |
| CP |
|
0.83% |
| GPV |
|
0.82% |
| EVP |
|
0.69% |
| SP |
|
0.55% |
| DS70 |
|
0.38% |
| Other |
|
0.48% |
References
- ↑ Nohlen, D & Stöver, P (2010) Elections in Europe: A data handbook, p1396 ISBN 978-3-8329-5609-7
- ↑ Nohlen & Stöver, p1414