Dutch general election, 1946
Dutch general election, 1946

|
|
|
|
All 100 seats to the House of Representatives
51 seats were needed for a majority |
| Turnout |
93.1% |
| |
First party |
Second party |
Third party |
| |
 |
 |
 |
| Leader |
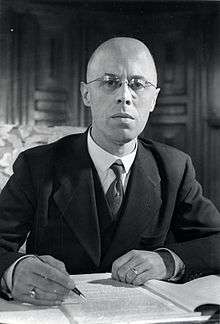
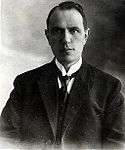
Louis Beel |
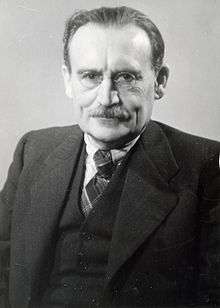
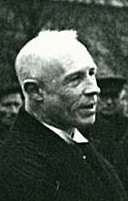
Willem Drees |
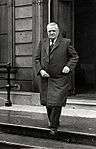
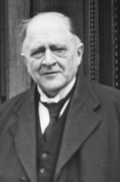
Jan Schouten |
| Party |
KVP |
PvdA |
ARP |
| Leader since |
not leader |
1946 |
1945 |
| Last election |
31 seats, 28.8% |
23 seats, 21.9% |
17 seats, 16.4% |
| Seats won |
32 |
29 |
13 |
| Seat change |
 1 1 |
6 |
 4 4 |
| Popular vote |
1,466,582 |
1,347,940 |
614,201 |
| Percentage |
30.8% |
28.3% |
12.9% |
|
| |
Fourth party |
Fifth party |
Sixth party |
| |
 |
 |
 |
| Leader |
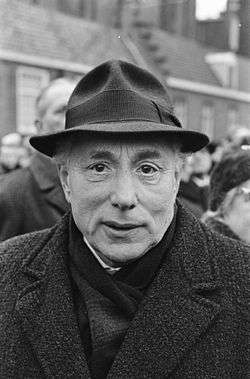
Paul de Groot |
Hendrik Tilanus |
Steven Bierema |
| Party |
CPN |
CHU |
PvdV |
| Leader since |
1945 |
1939 |
1946 |
| Last election |
3 seats, 3.4% |
8 seats, 7.5% |
4 seats, 4.0% |
| Seats won |
10 |
8 |
6 |
| Seat change |
7 |
 |
2 |
| Popular vote |
502,963 |
373,217 |
305,287 |
| Percentage |
10.6% |
7.8% |
6.4% |
|
| |
Seventh party |
|
| |
 |
|
| Leader |
Pieter Zandt |
|
| Party |
SGP |
|
| Leader since |
1945 |
|
| Last election |
2 seats, 1.9% |
|
| Seats won |
2 |
|
| Seat change |
|
|
| Popular vote |
101,759 |
|
| Percentage |
2.1% |
|
|
|
|
General elections were held in the Netherlands on 17 May 1946,[1] the first after World War II. The Catholic People's Party, a continuation of the pre-war Roman-Catholic State Party, remained the largest party in the House of Representatives, winning 32 of the 100 seats.[2]
Results
Indicated changes in seats are compared to the Schermerhorn-Drees cabinet appointed by Queen Wilhelmina after World War II.
| Party |
Votes |
% |
Seats |
+/– |
|---|
| Catholic People's Party | 1,466,582 | 30.8 | 32 | +1 |
| Labour Party | 1,347,940 | 28.3 | 29 | –3 |
| Anti Revolutionary Party | 614,201 | 12.9 | 13 | –4 |
| Communist Party of the Netherlands | 502,963 | 10.6 | 10 | +7 |
| Christian Historical Union | 373,217 | 7.8 | 8 | 0 |
| Freedom Party | 305,287 | 6.4 | 6 | +2 |
| Reformed Political Party | 101,759 | 2.1 | 2 | 0 |
| Protestant Union | 32,020 | 0.7 | 0 | New |
| Dutch Bellamy Party | 11,205 | 0.2 | 0 | New |
| Lopes Group | 5,537 | 0.1 | 0 | New |
| Invalid/blank votes | 152,304 | – | – | – |
| Total | 4,912,015 | 100 | 100 | 0 |
| Registered voters/turnout | 5,275,888 | 93.1 | – | – |
| Source: Nohlen & Stöver, Directory of small political parties 1918-1967 |
| Popular Vote |
|---|
|
|
|
|
|
| KVP |
|
30.81% |
| PvdA |
|
28.31% |
| ARP |
|
12.90% |
| CPN |
|
10.56% |
| CHU |
|
7.84% |
| PvdV |
|
6.41% |
| SGP |
|
2.14% |
| Other |
|
1.02% |
References
- ↑ Nohlen, D & Stöver, P (2010) Elections in Europe: A data handbook, p1396 ISBN 978-3-8329-5609-7
- ↑ Nohlen & Stöver, p1413