Carleton—Mississippi Mills (provincial electoral district)
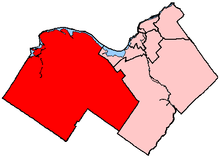 Carleton–Mississippi Mills in relation to other Ottawa electoral districts | |||
| Provincial electoral district | |||
| Legislature | Legislative Assembly of Ontario | ||
| MPP |
| ||
| District created | 2004 | ||
| First contested | 2007 | ||
| Last contested | 2014 | ||
| Demographics | |||
| Population (2006) | 128,915 | ||
| Electors (2007) | 91,649 | ||
| Area (km²) | 1,619 | ||
| Pop. density (per km²) | 79.6 | ||
| Census divisions | Ottawa, Lanark County | ||
| Census subdivisions | Mississippi Mills, West Carleton, Kanata, Goulbourn | ||
Carleton–Mississippi Mills is a provincial electoral district in eastern Ontario, Canada. It was created for the 2007 provincial election. 78.7% of the riding came from Lanark–Carleton while 21.3% came from Nepean–Carleton.
The riding includes the town of Mississippi Mills plus the former municipalities of West Carleton, Kanata and Goulbourn.
Members of Provincial Parliament
| Carleton—Mississippi Mills | ||||
|---|---|---|---|---|
| Assembly | Years | Member | Party | |
| Riding created from Lanark—Carleton and Nepean—Carleton | ||||
| 39th | 2007–2011 | Norm Sterling | Progressive Conservative | |
| 40th | 2011–2014 | Jack MacLaren | ||
| 41st | 2014–Present | |||
Election results
| Ontario general election, 2014 | ||||||||
|---|---|---|---|---|---|---|---|---|
| Party | Candidate | Votes | % | ∆% | ||||
| Progressive Conservative | Jack MacLaren | 30,590 | 47.49 | −2.80 | ||||
| Liberal | Rosalyn Stevens | 20,472 | 31.78 | −2.30 | ||||
| New Democratic | John Hansen | 8,744 | 13.57 | +2.23 | ||||
| Green | Andrew West | 4,614 | 7.16 | +3.85 | ||||
| Total valid votes | 64,420 | 100.0 | +14.54 | |||||
| Progressive Conservative hold | Swing | −0.25 | ||||||
Source(s)
"Official return from the records — 013, Carleton-Mississippi Mills" (PDF). Elections Ontario. 2014. Retrieved 27 June 2015. | ||||||||
| Ontario general election, 2011 | ||||||||
|---|---|---|---|---|---|---|---|---|
| Party | Candidate | Votes | % | ∆% | ||||
| Progressive Conservative | Jack MacLaren | 28,246 | 50.29 | +2.46 | ||||
| Liberal | Megan Cornell | 19,144 | 34.08 | +2.15 | ||||
| New Democratic | Liam Duff | 6,371 | 11.34 | +3.72 | ||||
| Green | Scott Simser | 1,857 | 3.31 | −7.19 | ||||
| Family Coalition | Cynthia Bredfeldt | 549 | 0.98 | +0.18 | ||||
| Total valid votes | 56,167 | 100.00 | +6.92 | |||||
| Total rejected, unmarked and declined ballots | 204 | 0.36 | −0.09 | |||||
| Turnout | 56,371 | 53.50 | −1.80 | |||||
| Eligible voters | 105,368 | +10.42 | ||||||
| Progressive Conservative hold | Swing | +0.16 | ||||||
Source(s) "Summary of Valid Votes Cast for Each Candidate – October 6, 2011 General Election" (PDF). Elections Ontario. Nov 18, 2011. Retrieved May 27, 2014. "Statistical Summary – General Elections 2011" ( | ||||||||
| Ontario general election, 2007 | ||||||||
|---|---|---|---|---|---|---|---|---|
| Party | Candidate | Votes | % | ∆% | ||||
| Progressive Conservative | Norm Sterling | 25,126 | 47.83 | −3.5 | ||||
| Liberal | Megan Cornell | 16,776 | 31.93 | −5.9 | ||||
| Green | John Ogilvie | 5,517 | 10.50 | |||||
| New Democratic | Michael Hadskis | 4,002 | 7.62 | +2.1 | ||||
| Libertarian | Rob Alexander | 693 | 1.32 | |||||
| Family Coalition | Reynolds James | 419 | 0.80 | |||||
| Total valid votes | 52,533 | 100.0 | ||||||
| Total rejected ballots | 238 | 0.45 | ||||||
| Turnout | 52,771 | 55.30 | ||||||
| Eligible voters | 95,421 | |||||||
| Note: Change in percentage of vote calculated on results redistributed from predecessor ridings. | ||||||||
Source(s) "Summary of Valid Votes Cast for Each Candidate – October 10, 2007 General Election" (PDF). Elections Ontario. Aug 14, 2008. Retrieved May 27, 2014. "Statistical Summary – General Elections 2007" (PDF). Elections Ontario. May 8, 2008. Retrieved May 27, 2014. | ||||||||
2007 electoral reform referendum
| Ontario electoral reform referendum, 2007 | |||
|---|---|---|---|
| Side | Votes | % | |
| First Past the Post | 36,565 | 70.5 | |
| Mixed member proportional | 15,326 | 29.5 | |
| Total valid votes | 51,891 | 100.0 | |