Redcar and Cleveland Borough Council elections
Redcar and Cleveland is a unitary authority in North Yorkshire, England. Until 1 April 1996 it was a non-metropolitan district in Cleveland.
Political control
Since the first election to the council in 1973 political control of the council has been held by the following parties:[1][2]
Non-metropolitan district
| Party in control | Years | |
|---|---|---|
| No overall control | 1973-1976 | |
| Conservative | 1976-1979 | |
| Labour | 1979-1987 | |
| No overall control | 1987-1991 | |
| Labour | 1991-1996 | |
Unitary authority
| Party in control | Years | |
|---|---|---|
| Labour | 1995–2003 | |
| No overall control | 2003–2011 | |
| Labour | 2011–2013[3] | |
| No overall control | 2013–present | |
Council elections
Non-metropolitan district elections
- Langbaurgh Borough Council election, 1973
- Langbaurgh Borough Council election, 1976 (New ward boundaries)[4]
- Langbaurgh Borough Council election, 1979
- Langbaurgh Borough Council election, 1983
- Langbaurgh Borough Council election, 1987
- Langbaurgh-on-Tees Borough Council election, 1991 (New ward boundaries)[5]
Unitary authority elections
- Redcar and Cleveland Borough Council election, 1995
- Redcar and Cleveland Borough Council election, 1999
- Redcar and Cleveland Borough Council election, 2003 (New ward boundaries)[6][7][8]
- Redcar and Cleveland Borough Council election, 2007
- Redcar and Cleveland Borough Council election, 2011
- Redcar and Cleveland Borough Council election, 2015
Borough result maps
-
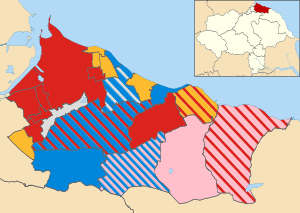
2003 results map
-
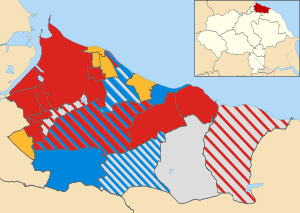
2007 results map
-
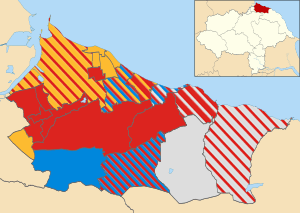
2011 results map
-
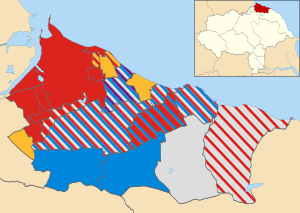
2015 results map
By-election results
1995–1999
| Party | Candidate | Votes | % | ± | |
|---|---|---|---|---|---|
| Liberal Democrat | Joyce Benbow | 771 | 39.4 | ||
| Labour | John Taylor | 742 | 37.9 | ||
| Conservative | Jean White | 445 | 22.7 | ||
| Majority | 29 | 1.5 | |||
| Turnout | 1,958 | 35.0 | |||
| Liberal Democrat gain from Labour | Swing | ||||
| Party | Candidate | Votes | % | ± | |
|---|---|---|---|---|---|
| Labour | John Simms | 2,168 | 56.2 | -21.5 | |
| Independent | Ray Freeman | 1,362 | 35.3 | +35.3 | |
| Conservative | Yvonne Bennett | 329 | 8.5 | +8.5 | |
| Majority | 806 | 20.9 | |||
| Turnout | 3,859 | ||||
| Labour hold | Swing | ||||
| Party | Candidate | Votes | % | ± | |
|---|---|---|---|---|---|
| Labour | 488 | 58.2 | -15.1 | ||
| Independent | 201 | 24.0 | +24.0 | ||
| Conservative | 150 | 17.9 | -8.8 | ||
| Majority | 287 | 34.2 | |||
| Turnout | 839 | ||||
| Labour hold | Swing | ||||
1999–2003
| Party | Candidate | Votes | % | ± | |
|---|---|---|---|---|---|
| Labour | Sheelagh Clarke | 736 | 40.5 | -22.2 | |
| Conservative | David Tabner | 537 | 29.5 | +29.5 | |
| Liberal Democrat | Vera Butler | 509 | 28.0 | -9.3 | |
| Socialist Labour | John Taylor | 36 | 2.0 | +2.0 | |
| Majority | 199 | 11.0 | |||
| Turnout | 1,818 | 34.2 | |||
| Labour hold | Swing | ||||
| Party | Candidate | Votes | % | ± | |
|---|---|---|---|---|---|
| Independent | Dave Fitzpatrick | 1,918 | 59.4 | +45.3 | |
| Labour | Susan McLeod | 722 | 22.4 | -40.1 | |
| Conservative | Marjorie Veal | 333 | 10.3 | -12.6 | |
| Liberal Democrat | Val Miller | 257 | 8.0 | +8.0 | |
| Majority | 1,196 | 37.0 | |||
| Turnout | 3,230 | ||||
| Independent gain from Labour | Swing | ||||
| Party | Candidate | Votes | % | ± | |
|---|---|---|---|---|---|
| Labour | Peter Dunlop | 463 | 63.3 | -9.3 | |
| Liberal Democrat | Paul Tuffs | 242 | 33.1 | +22.0 | |
| Conservative | Lynda Russell | 27 | 3.7 | +3.7 | |
| Majority | 199 | 30.2 | |||
| Turnout | 732 | 16.3 | |||
| Labour hold | Swing | ||||
| Party | Candidate | Votes | % | ± | |
|---|---|---|---|---|---|
| Liberal Democrat | Bill Goodwell | 599 | 35.8 | -13.4 | |
| Independent | Mike Findley | 587 | 35.1 | +35.1 | |
| Labour | Sue McLeod | 199 | 11.9 | -23.0 | |
| Green | Peter Goodwin | 173 | 10.3 | +10.3 | |
| Conservative | Neil Bilham | 114 | 6.8 | -9.1 | |
| Majority | 12 | 0.7 | |||
| Turnout | 1,672 | 48.3 | |||
| Liberal Democrat gain from Socialist Labour | Swing | ||||
2003–2007
| Party | Candidate | Votes | % | ± | |
|---|---|---|---|---|---|
| Labour | Denise Bunn | 818 | 34.3 | +5.9 | |
| East Cleveland Independent | David Williams | 805 | 33.7 | +0.3 | |
| Conservative | Michael King | 626 | 26.2 | -12.0 | |
| Independent | Barry Parvin | 137 | 5.7 | +5.7 | |
| Majority | 13 | 0.6 | |||
| Turnout | 2,386 | 67.4 | |||
| Labour gain from Independent | Swing | ||||
2007–2011
| Party | Candidate | Votes | % | ± | |
|---|---|---|---|---|---|
| Conservative | Bill Clarke | 1,124 | 55.9 | +13.5 | |
| Labour | Bill Suthers | 887 | 44.1 | -0.8 | |
| Majority | 237 | 11.8 | |||
| Turnout | 2,011 | 34.4 | |||
| Conservative hold | Swing | ||||
| Party | Candidate | Votes | % | ± | |
|---|---|---|---|---|---|
| Liberal Democrat | John Hannon | 1,031 | 56.4 | +25.5 | |
| Labour | Paul Dixon | 486 | 26.6 | -15.9 | |
| Conservative | Brian Mundy | 204 | 11.2 | -15.5 | |
| BNP | Dawn Castle | 106 | 5.8 | +5.8 | |
| Majority | 545 | 29.8 | |||
| Turnout | 1,827 | 36.8 | |||
| Liberal Democrat gain from Labour | Swing | ||||
| Party | Candidate | Votes | % | ± | |
|---|---|---|---|---|---|
| Labour | Marilyn Bramley | 652 | 49.9 | -0.6 | |
| Liberal Democrat | Toni Meir | 288 | 22.1 | +12.3 | |
| BNP | Bernard Collinson | 206 | 15.8 | +1.4 | |
| Independent | Oz Sadiq | 101 | 7.7 | -7.3 | |
| Conservative | Joan Bolton | 59 | 4.5 | -5.8 | |
| Majority | 364 | 27.8 | |||
| Turnout | 1,306 | 27.6 | |||
| Labour hold | Swing | ||||
| Party | Candidate | Votes | % | ± | |
|---|---|---|---|---|---|
| Liberal Democrat | Ken Lucas | 809 | 42.4 | +17.3 | |
| Labour | Marian Fairley | 667 | 35.0 | -17.1 | |
| BNP | Lynn Payne | 305 | 16.6 | +16.6 | |
| Conservative | Brian Hughes-Mundy | 125 | 6.6 | -16.2 | |
| Majority | 142 | 7.4 | |||
| Turnout | 1,906 | 36.8 | |||
| Liberal Democrat gain from Labour | Swing | ||||
| Party | Candidate | Votes | % | ± | |
|---|---|---|---|---|---|
| Liberal Democrat | Eric Howden | 805 | 52.3 | +27.2 | |
| Labour | Richard Green | 515 | 33.5 | -18.6 | |
| BNP | Lynn Payne | 145 | 9.4 | +9.4 | |
| Conservative | Joan Bolton | 73 | 4.7 | -18.0 | |
| Majority | 290 | 18.8 | |||
| Turnout | 1,538 | 29.9 | |||
| Liberal Democrat gain from Labour | Swing | ||||
| Party | Candidate | Votes | % | ± | |
|---|---|---|---|---|---|
| Labour | Sue Jeffrey | 442 | 43.6 | -6.9 | |
| Liberal Democrat | Steven Abbott | 354 | 34.9 | +25.1 | |
| Independent | Vincent Smith | 102 | 10.1 | -5.0 | |
| UKIP | Martin Bulmer | 69 | 6.8 | +6.8 | |
| Conservative | Joan Bolton | 47 | 4.6 | -5.7 | |
| Majority | 88 | 8.7 | |||
| Turnout | 1,014 | 21.2 | |||
| Labour hold | Swing | ||||
| Party | Candidate | Votes | % | ± | |
|---|---|---|---|---|---|
| Liberal Democrat | Ann Wilson | 1,084 | 73.5 | +12.4 | |
| Labour | Steve Goldswain | 210 | 14.2 | -5.0 | |
| UKIP | Martin Bulmer | 103 | 7.0 | +7.0 | |
| Conservative | Colin Jones | 77 | 5.2 | -14.4 | |
| Majority | 874 | 59.3 | |||
| Turnout | 1,474 | 29.6 | |||
| Liberal Democrat hold | Swing | ||||
| Party | Candidate | Votes | % | ± | |
|---|---|---|---|---|---|
| Labour | Doreen Rudland | 565 | 38.1 | -1.0 | |
| Independent | Barry Hunt | 351 | 23.7 | +10.9 | |
| Liberal Democrat | Valerie Miller | 315 | 21.2 | -7.8 | |
| Conservative | Don Agar | 220 | 14.8 | -4.4 | |
| BNP | Michael George | 33 | 2.2 | +2.2 | |
| Majority | 214 | 14.4 | |||
| Turnout | 1,484 | 27.8 | |||
| Labour hold | Swing | ||||
2011–2015
| Party | Candidate | Votes | % | ± | |
|---|---|---|---|---|---|
| Liberal Democrat | Ron Harrison | 661 | |||
| Liberal Democrat | Josh Mason | 633 | |||
| Labour | Norma Hensby | 531 | |||
| Labour | Celia Elliott | 512 | |||
| Conservative | Michael Bateman | 217 | |||
| Conservative | Brian Hughes-Munday | 142 | |||
| UKIP | Ian Neil | 50 | |||
| Turnout | 2,746 | 36.8 | |||
| Liberal Democrat hold | Swing | ||||
| Liberal Democrat hold | Swing | ||||
| Party | Candidate | Votes | % | ± | |
|---|---|---|---|---|---|
| Labour | John P Hannon | 539 | 49.0 | ||
| Liberal Democrat | Dave Stones | 484 | 44.0 | ||
| Conservative | Matthew Bennett | 76 | 6.9 | ||
| Majority | 55 | 5.0 | |||
| Turnout | 1,099 | 33.88 | |||
| Labour gain from Liberal Democrat | Swing | ||||
| Party | Candidate | Votes | % | ± | |
|---|---|---|---|---|---|
| Labour | David Walsh | 745 | 46.1 | ||
| UKIP | Stuart Todd | 485 | 30.0 | ||
| Conservative | Anne Watts | 176 | 10.9 | ||
| Independent | James Carrolle | 170 | 10.5 | ||
| Liberal Democrat | Rodney Waite | 40 | 2.5 | ||
| Majority | 260 | 16.1 | |||
| Turnout | 1,616 | 28.3 | |||
| Labour hold | Swing | ||||
| Party | Candidate | Votes | % | ± | |
|---|---|---|---|---|---|
| Liberal Democrat | Sabrina Thompson | 753 | 37.3 | ||
| Labour | Neil Bendelow | 741 | 36.7 | ||
| UKIP | Andrea Turner | 523 | 25.9 | ||
| Majority | 12 | 0.6 | |||
| Turnout | 2,017 | 38.9 | |||
| Liberal Democrat hold | Swing | ||||
2015–2019
| Party | Candidate | Votes | % | ± | |
|---|---|---|---|---|---|
| Conservative | Caroline Jackson | 879 | 45.0 | ||
| Liberal Democrat | Arthur Kidd | 536 | 27.4 | ||
| Labour | Ian Taylor | 368 | 18.8 | ||
| UKIP | Kenneth Lilleker | 116 | 5.9 | ||
| Independent | George Tinsley | 56 | 2.9 | ||
| Majority | 343 | 17.6 | |||
| Turnout | 1,955 | 33.3 | |||
| Conservative hold | Swing | ||||
| Party | Candidate | Votes | % | ± | |
|---|---|---|---|---|---|
| Liberal Democrat | Carole Morgan | 980 | 75.4 | +37.3 | |
| UKIP | Ian Neil | 138 | 10.6 | -6.8 | |
| Labour | Alison Suthers | 126 | 9.7 | -9.4 | |
| Conservative | Cameron Brown | 41 | 3.2 | -8.4 | |
| North East Party | Philip Lockey | 15 | 1.2 | N/A | |
| Majority | 842 | 64.8 | |||
| Turnout | 1,300 | 27.5 | |||
| Liberal Democrat hold | Swing | ||||
References
- ↑ "Council compositions". The Elections Centre. Retrieved 3 May 2016.
- ↑ "England council elections". BBC News Online. 10 May 2011. Retrieved 28 October 2011.
- ↑ Hetherington, Graeme (31 July 2013). "Redcar and Cleveland Labour group lose overall control of council following latest defections". The Northern Echo. Retrieved 5 September 2013.
- ↑ legislation.gov.uk - The Borough of Langbaurgh (Electoral Arrangements) Order 1975. Retrieved on 4 November 2015.
- ↑ legislation.gov.uk - The Borough of Langbaurgh (Electoral Arrangements) Order 1991. Retrieved on 4 November 2015.
- ↑ legislation.gov.uk - The Borough of Redcar and Cleveland (Electoral Changes) Order 2003. Retrieved on 3 November 2015.
- ↑ "Local elections". BBC News Online. Retrieved 6 September 2009.
- ↑ "Elections & Voting". Redcar & Cleveland Borough Council. Retrieved 19 March 2010.
- ↑ Anderson, Sally (26 July 1996). "Lib Dems in shock victory". Evening Gazette. p. 11.
- ↑ "Labour triumph". Evening Gazette. 3 May 1997. p. 14.
- ↑ "Labour holds by election seat to stop slide". The Northern Echo. 22 July 2000. Retrieved 12 August 2013.
- ↑ "By-election result". Redcar & Cleveland Borough Council. 15 March 2002. Retrieved 6 September 2009.
- ↑ "By-election result". Redcar & Cleveland Borough Council. 28 June 2002. Retrieved 6 September 2009.
- ↑ "May 2005 Election Results". Redcar & Cleveland Borough Council. Retrieved 6 September 2009.
- ↑ "In brief: Tory by-election win". Evening Gazette. 13 September 2008. p. 3.
- ↑ "By-election Kirkleatham result". Redcar & Cleveland Borough Council. 3 October 2008. Retrieved 6 September 2009.
- ↑ "South Bank by election result". Redcar & Cleveland Borough Council. 17 October 2008. Retrieved 6 September 2009.
- ↑ "Dormanstown by-election result". Redcar & Cleveland Borough Council. 3 April 2009. Retrieved 6 September 2009.
- ↑ "By-election result". Redcar & Cleveland Borough Council. 24 July 2009. Retrieved 6 September 2009.
- ↑ "By election result". Redcar & Cleveland Borough Council. 18 September 2009. Retrieved 25 September 2009.
- ↑ "Ormesby ward by-election result". Redcar & Cleveland Borough Council. 4 December 2009. Retrieved 4 December 2009.
- ↑ "Election joy for Doreen.". Evening Gazette. The Free Library. 28 August 2010. Retrieved 28 October 2011.
- ↑ Robson, Dave (19 November 2011). "Zetland ward councillor is elected again". Evening Gazette. Retrieved 25 November 2011.
- ↑ "Labour wins Redcar by-election.". Evening Gazette. 20 January 2012. Retrieved 20 January 2012.
- ↑ "Skelton by-election: Labour win by 260 votes". Evening Gazette. 9 August 2013. Retrieved 12 August 2013.
- ↑ Robson, Dave (23 May 2014). "Liberal Democrats celebrate Dormanstown by-election success". Evening Gazette. Retrieved 25 May 2014.
- ↑ "Declaration of results" (PDF). Redcar & Cleveland Borough Council. 18 March 2016. Retrieved 19 March 2016.
- ↑ "Ormesby Ward Declaration of Results" (PDF). Redcar & Cleveland Borough Council. 19 August 2016. Retrieved 20 August 2016.
External links
| North Yorkshire County Council | |
|---|---|
| City of York Council | |
| Craven District Council | |
| Hambleton District Council |
|
| Harrogate Borough Council | |
| Middlesbrough Borough Council | |
| Redcar and Cleveland Borough Council | |
| Richmondshire District Council | |
| Ryedale District Council | |
| Scarborough Borough Council | |
| Selby District Council |
|
| Stockton-on-Tees Borough Council |
|
| Cleveland County Council |
|
| Tees Valley Mayor | |
| |
This article is issued from Wikipedia - version of the 9/11/2016. The text is available under the Creative Commons Attribution/Share Alike but additional terms may apply for the media files.