Climate graph
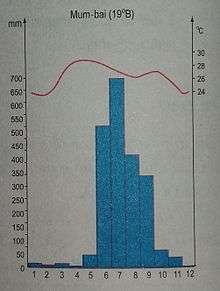
Climate graph of Mumbai
| Chittagong | ||||||||||||||||||||||||||||||||||||||||||||||||||||||||||||
|---|---|---|---|---|---|---|---|---|---|---|---|---|---|---|---|---|---|---|---|---|---|---|---|---|---|---|---|---|---|---|---|---|---|---|---|---|---|---|---|---|---|---|---|---|---|---|---|---|---|---|---|---|---|---|---|---|---|---|---|---|
| Climate chart (explanation) | ||||||||||||||||||||||||||||||||||||||||||||||||||||||||||||
| ||||||||||||||||||||||||||||||||||||||||||||||||||||||||||||
A climate graph is a chart that shows average weather for a certain period of time, for a certain location. The precipitation is usually shown using a bar graph and the temperature is usually shown as a line graph.
References
This article is issued from Wikipedia - version of the 11/22/2016. The text is available under the Creative Commons Attribution/Share Alike but additional terms may apply for the media files.