California's 7th congressional district
| California's 7th congressional district | ||
|---|---|---|
.tif.png) | ||
| Current Representative | Ami Bera (D–Elk Grove) | |
| Ethnicity | 57.2% White, 8.2% Black, 15.9% Asian, 16.1% Hispanic, 2.7[1]% other | |
| Cook PVI | EVEN | |
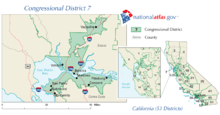
California's 7th congressional district is a congressional district in the U.S. state of California.
Ami Bera, a Democrat, has represented the district since January 2013.
- Current district
The 7th district represents eastern Sacramento County.
Cities in the district include:[2]
- Former
Prior to redistricting by the California Citizens Redistricting Commission of 2011, the 7th district was centered on Benicia. It consisted of portions of Solano and Contra Costa counties. Most of that territory is now the 11th District. Meanwhile, most of the current 7th had been the 3rd District prior to 2013.
Competitiveness
Before the 2013 redrawing of the district, it was solidly Democratic. However, the new district is rated "even" by the Cook Partisan Voting Index.
Election results from statewide races
| Year | Office | Results |
|---|---|---|
| 1992 | President | Clinton 60.8 - 22.3% |
| Senator | Boxer 63.2 - 27.4% | |
| Senator | Feinstein 70.0 - 23.7% | |
| 1994 | Governor | [Data unknown/missing. You can help!] |
| Senator | [Data unknown/missing. You can help!] | |
| 1996 | President | [Data unknown/missing. You can help!] |
| 1998 | Governor | [Data unknown/missing. You can help!] |
| Senator | [Data unknown/missing. You can help!] | |
| 2000 | President[3] | Gore 68.7 - 26.8% |
| Senator[4] | Feinstein 69.0 - 24.4% | |
| 2002 | Governor[5] | Davis 59.7 - 29.1% |
| 2003 | Recall[6][7] | No 60.8 - 39.2% |
| Bustamante 44.3 - 34.5% | ||
| 2004 | President[8] | Kerry 67.1 - 31.8% |
| Senator[9] | Boxer 69.3 - 26.9% | |
| 2006 | Governor[10] | Angelides 50.4 - 44.0% |
| Senator[11] | Feinstein 71.0 - 23.6% | |
| 2008 | President[12] | Obama 71.4 - 26.4% |
| 2010 | Governor | Brown 67.1 - 28.3% |
| Senator | Boxer 65.4 - 29.4% | |
| 2012 | President[13] | Obama 50.8 - 46.8% |
List of representatives
| Representative | Party | Dates | Notes | Counties |
|---|---|---|---|---|
| District created | March 4, 1893 | |||
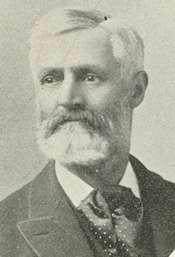 William W. Bowers William W. Bowers |
Republican | March 4, 1893 – March 3, 1897 |
Redistricted from the 6th district Lost re-election |
Fresno, Kern, Kings, Madera, Merced, Orange, Riverside, San Benito, San Bernardino, San Diego, Stanislaus, Tulare |
.jpg) Curtis H. Castle Curtis H. Castle |
Populist | March 4, 1897 – March 3, 1899 |
Lost re-election | |
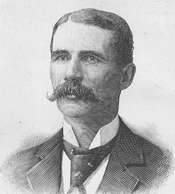
 James C. Needham James C. Needham |
Republican | March 4, 1899 – March 3, 1903 |
Redistricted to the 6th district | |
 James McLachlan James McLachlan |
Republican | March 4, 1903 – March 3, 1911 |
Redistricted from the 6th district Lost renomination |
Los Angeles County |
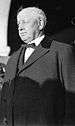 William Stephens William Stephens |
Republican | March 4, 1911 – March 3, 1913 |
Redistricted to the 10th district | |
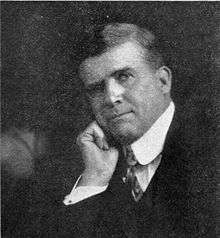 Denver S. Church Denver S. Church |
Democratic | March 4, 1913 – March 3, 1919 |
Retired | Fresno, Kern, Kings, Madera, Merced, Stanislaus, Tulare |
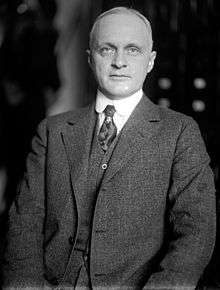 Henry E. Barbour Henry E. Barbour |
Republican | March 4, 1919 – March 3, 1933 |
Lost re-election | |
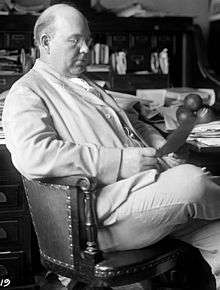
.jpg) Ralph R. Eltse Ralph R. Eltse |
Republican | March 4, 1933 – January 3, 1935 |
Lost re-election | Alameda, Contra Costa |
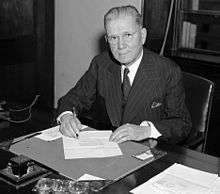 John H. Tolan John H. Tolan |
Democratic | January 3, 1935 – January 3, 1943 |
||
| January 3, 1943 – January 3, 1947 |
Alameda (Oakland) | |||
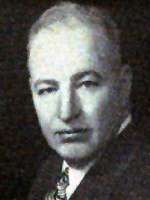 John J. Allen, Jr. John J. Allen, Jr. |
Republican | January 3, 1947 – January 3, 1959 |
Lost re-election | |
 Jeffery Cohelan Jeffery Cohelan |
Democratic | January 3, 1959 – January 3, 1971 |
Lost re-nomination | |
 Ron Dellums Ron Dellums |
Democratic | January 3, 1971 – January 3, 1975 |
Redistricted to the 8th district | |
 George Miller George Miller |
Democratic | January 3, 1975 – January 3, 1983 |
Contra Costa | |
| January 3, 1983 – January 3, 1993 |
Most of Contra Costa | |||
| January 3, 1993 – January 3, 2003 |
Northwest Contra Costa, southwest Solano | |||
| January 3, 2003 – January 3, 2013 |
Redistricted to the 11th district | Northern Contra Costa, western Solano | ||
 Ami Bera Ami Bera |
Democratic | January 3, 2013 – present |
Eastern Sacramento County | |
Election results for representatives
|
1892 • 1894 • 1896 • 1898 • 1900 • 1902 • 1904 • 1906 • 1908 • 1910 • 1912 • 1914 • 1916 • 1918 • 1920 • 1922 • 1924 • 1926 • 1928 • 1930 • 1932 • 1934 • 1936 • 1938 • 1940 • 1942 • 1944 • 1946 • 1948 • 1950 • 1952 • 1954 • 1956 • 1958 • 1960 • 1962 • 1964 • 1966 • 1968 • 1970 • 1972 • 1974 • 1976 • 1978 • 1980 • 1982 • 1984 • 1986 • 1988 • 1990 • 1992 • 1994 • 1996 • 1998 • 2000 • 2002 • 2004 • 2006 • 2008 • 2010 • 2012 • 2014 |
1892
| Party | Candidate | Votes | % | |
|---|---|---|---|---|
| Republican | William W. Bowers (inc.) | 15,856 | 41.6 | |
| Democratic | Olin Welborn | 14,869 | 39.0 | |
| Populist | Hiram Hamilton | 5,578 | 14.6 | |
| Prohibition | M. B. Harris | 1,844 | 4.8 | |
| Total votes | 38,147 | 100.0 | ||
| Voter turnout | % | |||
| Republican hold | ||||
1894
| Party | Candidate | Votes | % | |
|---|---|---|---|---|
| Republican | William W. Bowers (inc.) | 18,434 | 42.9 | |
| Democratic | W. H. Alford | 12,111 | 28.2 | |
| Populist | J. L. Gilbert | 10,719 | 25.0 | |
| Prohibition | W. H. Somers | 1,669 | 3.9 | |
| Total votes | 42,933 | 100.0 | ||
| Voter turnout | % | |||
| Republican hold | ||||
1896
| Party | Candidate | Votes | % | |||
|---|---|---|---|---|---|---|
| Populist | Curtis H. Castle | 19,183 | 46.7 | |||
| Republican | William W. Bowers (inc.) | 18,939 | 46.1 | |||
| Independent | William H. "Billy" Carlson | 2,139 | 5.2 | |||
| Prohibition | James W. Webb | 802 | 2.0 | |||
| Total votes | 41,063 | 100.0 | ||||
| Voter turnout | % | |||||
| Populist gain from Republican | ||||||
1898
| Party | Candidate | Votes | % | |||
|---|---|---|---|---|---|---|
| Republican | James C. Needham | 20,793 | 50.1 | |||
| Populist | Curtis H. Castle (incumbent) | 20,680 | 49.9 | |||
| Total votes | 41,473 | 100.0 | ||||
| Voter turnout | % | |||||
| Republican gain from Populist | ||||||
1900
| Party | Candidate | Votes | % | |
|---|---|---|---|---|
| Republican | James C. Needham (inc.) | 23,450 | 52.4 | |
| Democratic | W. D. Crichton | 18,981 | 42.4 | |
| Socialist | Noble A. Richardson | 1,385 | 3.1 | |
| Prohibition | A. H. Hensley | 919 | 2.1 | |
| Total votes | 44,735 | 100.0 | ||
| Voter turnout | % | |||
| Republican hold | ||||
1902
| Party | Candidate | Votes | % | |
|---|---|---|---|---|
| Republican | James McLachlan (inc.) | 19,407 | 64.8 | |
| Democratic | Carl A. Johnson | 8,075 | 27.0 | |
| Socialist | George H. Hewes | 1,261 | 4.2 | |
| Prohibition | Frederick F. Wheeler | 1,195 | 4.0 | |
| Total votes | 30,638 | 100.0 | ||
| Voter turnout | % | |||
| Republican hold | ||||
1904
| Party | Candidate | Votes | % | |
|---|---|---|---|---|
| Republican | James McLachlan (inc.) | 31,091 | 64.2 | |
| Democratic | W. O. Morton | 11,259 | 23.3 | |
| Socialist | F. I. Wheat | 3,594 | 7.4 | |
| Prohibition | John Sobieski | 2,467 | 5.1 | |
| Total votes | 48,411 | 100.0 | ||
| Voter turnout | % | |||
| Republican hold | ||||
1906
| Party | Candidate | Votes | % | |
|---|---|---|---|---|
| Republican | James McLachlan (inc.) | 22,338 | 56.8 | |
| Democratic | Robert G. Laucks | 11,197 | 28.4 | |
| Socialist | Claude Riddle | 3,641 | 9.2 | |
| Prohibition | Levi D. Johnson | 2,189 | 5.6 | |
| Total votes | 39,365 | 100.0 | ||
| Voter turnout | % | |||
| Republican hold | ||||
1908
| Party | Candidate | Votes | % | |
|---|---|---|---|---|
| Republican | James McLachlan (inc.) | 37,244 | 51.9 | |
| Democratic | Jud R. Rush | 25,445 | 35.4 | |
| Socialist | A. R. Holston | 4,432 | 6.2 | |
| Prohibition | Marshall W. Atwood | 3,899 | 5.4 | |
| Independence League | F. G. Hentig | 791 | 1.1 | |
| Total votes | 71,811 | 100.0 | ||
| Voter turnout | % | |||
| Republican hold | ||||
1910
| Party | Candidate | Votes | % | |
|---|---|---|---|---|
| Republican | William Stephens (incumbent) | 36,435 | 58.7 | |
| Democratic | Lorin A. Handley | 13,340 | 21.5 | |
| Socialist | Thomas V. Williams | 10,305 | 16.6 | |
| Prohibition | C. V. LeFontaine | 1,990 | 3.2 | |
| Total votes | 62,070 | 100.0 | ||
| Voter turnout | % | |||
| Republican hold | ||||
1912
| Party | Candidate | Votes | % | |
|---|---|---|---|---|
| Democratic | Denver S. Church (inc.) | 23,752 | 44.0 | |
| Republican | James C. Needham | 22,994 | 42.7 | |
| Socialist | J. S. Cato | 7,171 | 13.3 | |
| Total votes | 53,917 | 100.0 | ||
| Voter turnout | % | |||
| Democratic hold | ||||
1914
| Party | Candidate | Votes | % | |
|---|---|---|---|---|
| Democratic | Denver S. Church (inc.) | 39,389 | 49.9 | |
| Republican | A. M. Drew | 25,106 | 31.8 | |
| Socialist | Harry M. McKee | 7,797 | 9.9 | |
| Prohibition | Don A. Allen | 6,573 | 8.3 | |
| Total votes | 78,865 | 100.0 | ||
| Voter turnout | % | |||
| Democratic hold | ||||
1916
| Party | Candidate | Votes | % | |
|---|---|---|---|---|
| Democratic | Denver S. Church (inc.) | 38,787 | 51.0 | |
| Republican | W. W. Phillips | 27,676 | 36.4 | |
| Socialist | Harry M. McKee | 5,492 | 7.2 | |
| Prohibition | J. F. Butler | 4,042 | 5.3 | |
| Total votes | 75,997 | 100.0 | ||
| Voter turnout | % | |||
| Democratic hold | ||||
1918
| Party | Candidate | Votes | % | |||
|---|---|---|---|---|---|---|
| Republican | Henry E. Barbour | 33,476 | 52.1 | |||
| Democratic | Henry Hawson | 30,745 | 47.9 | |||
| Total votes | 64,221 | 100.0 | ||||
| Voter turnout | % | |||||
| Republican gain from Democratic | ||||||
1920
| Party | Candidate | Votes | % | |
|---|---|---|---|---|
| Republican | Henry E. Barbour (incumbent) | 57,647 | 87.2 | |
| Socialist | Harry M. McKee | 8,449 | 12.8 | |
| Total votes | 66,096 | 100.0 | ||
| Voter turnout | % | |||
| Republican hold | ||||
1922
| Party | Candidate | Votes | % | |
|---|---|---|---|---|
| Republican | Henry E. Barbour (incumbent) | 67,000 | 100.0 | |
| Voter turnout | % | |||
| Republican hold | ||||
1924
| Party | Candidate | Votes | % | |
|---|---|---|---|---|
| Republican | Henry E. Barbour (incumbent) | 65,740 | 100.0 | |
| Voter turnout | % | |||
| Republican hold | ||||
1926
| Party | Candidate | Votes | % | |
|---|---|---|---|---|
| Republican | Henry E. Barbour (incumbent) | 73,271 | 100.0 | |
| Voter turnout | % | |||
| Republican hold | ||||
1928
| Party | Candidate | Votes | % | |
|---|---|---|---|---|
| Republican | Henry E. Barbour (incumbent) | 71,195 | 100.0 | |
| Voter turnout | % | |||
| Republican hold | ||||
1930
| Party | Candidate | Votes | % | |
|---|---|---|---|---|
| Republican | Henry E. Barbour (incumbent) | 79,041 | 100.0 | |
| Voter turnout | % | |||
| Republican hold | ||||
1932
| Party | Candidate | Votes | % | ||
|---|---|---|---|---|---|
| Republican | Ralph R. Eltse | 45,944 | 45.5 | ||
| Democratic | Frank V. Cornish | 32,365 | 32.0 | ||
| Socialist | J. Stitt Wilson | 22,767 | 22.5 | ||
| Total votes | 101,076 | 100.0 | |||
| Voter turnout | % | ||||
| Republican win (new seat) | |||||
1934
| Party | Candidate | Votes | % | |||
|---|---|---|---|---|---|---|
| Democratic | John H. Tolan | 51,962 | 52.3 | |||
| Republican | Ralph R. Eltse (incumbent) | 47,414 | 47.7 | |||
| Total votes | 99,376 | 100.0 | ||||
| Voter turnout | % | |||||
| Democratic gain from Republican | ||||||
1936
| Party | Candidate | Votes | % | |
|---|---|---|---|---|
| Democratic | John H. Tolan (incumbent) | 69,463 | 59.8 | |
| Republican | Charles W. Fisher | 46,647 | 40.2 | |
| Total votes | 116,110 | 100.0 | ||
| Voter turnout | % | |||
| Democratic hold | ||||
1938
| Party | Candidate | Votes | % | |
|---|---|---|---|---|
| Democratic | John H. Tolan (incumbent) | 62,599 | 55.3 | |
| Republican | Charles W. Fisher | 50,504 | 44.7 | |
| Total votes | 113,103 | 100.0 | ||
| Voter turnout | % | |||
| Democratic hold | ||||
1940
| Party | Candidate | Votes | % | |
|---|---|---|---|---|
| Democratic | John H. Tolan (incumbent) | 72,838 | 55.5 | |
| Republican | Ralph R. Eltse | 56,808 | 43.2 | |
| Communist | Alfred N. Johnson | 1,707 | 1.3 | |
| Total votes | 131,353 | 100.0 | ||
| Voter turnout | % | |||
| Democratic hold | ||||
1942
| Party | Candidate | Votes | % | |
|---|---|---|---|---|
| Democratic | John H. Tolan (incumbent) | 77,292 | 100.0 | |
| Voter turnout | % | |||
| Democratic hold | ||||
1944
| Party | Candidate | Votes | % | |||
|---|---|---|---|---|---|---|
| Democratic | John H. Tolan (incumbent) | 81,762 | 57.9 | |||
| Republican | Chelsey M. Walter | 59,360 | 42.1 | |||
| Total votes | 141,122 | 100.0 | ||||
| Voter turnout | % | |||||
| Democratic gain from Republican | ||||||
1946
| Party | Candidate | Votes | % | |||
|---|---|---|---|---|---|---|
| Republican | John J. Allen, Jr. | 61,508 | 56.2 | |||
| Democratic | Patrick W. McDonough | 47,988 | 43.8 | |||
| Total votes | 109,496 | 100.0 | ||||
| Voter turnout | % | |||||
| Republican gain from Democratic | ||||||
1948
| Party | Candidate | Votes | % | |
|---|---|---|---|---|
| Republican | John J. Allen, Jr. (incumbent) | 78,534 | 51.4 | |
| Democratic | Buel G. Gallagher | 74,318 | 48.6 | |
| Total votes | 152,852 | 100.0 | ||
| Voter turnout | % | |||
| Republican hold | ||||
1950
| Party | Candidate | Votes | % | |
|---|---|---|---|---|
| Republican | John J. Allen, Jr. (incumbent) | 74,069 | 55.3 | |
| Democratic | Lyle E. Cook | 59,976 | 44.7 | |
| Total votes | 134,045 | 100.0 | ||
| Voter turnout | % | |||
| Republican hold | ||||
1952
| Party | Candidate | Votes | % | |
|---|---|---|---|---|
| Republican | John J. Allen, Jr. (incumbent) | 120,666 | 84.3 | |
| Progressive | John Allen Johnson | 22,408 | 15.7 | |
| Total votes | 142,074 | 100.0 | ||
| Voter turnout | % | |||
| Republican hold | ||||
1954
| Party | Candidate | Votes | % | |
|---|---|---|---|---|
| Republican | John J. Allen, Jr. (incumbent) | 64,083 | 53 | |
| Democratic | Stanley K. Crook | 56,807 | 47 | |
| Total votes | 120,890 | 100 | ||
| Voter turnout | % | |||
| Republican hold | ||||
1956
| Party | Candidate | Votes | % | |
|---|---|---|---|---|
| Republican | John J. Allen, Jr. (incumbent) | 75,932 | 52.8 | |
| Democratic | Laurance L. Cross | 67,931 | 47.2 | |
| Total votes | 143,863 | 100.0 | ||
| Voter turnout | % | |||
| Republican hold | ||||
1958
| Party | Candidate | Votes | % | |||
|---|---|---|---|---|---|---|
| Democratic | Jeffery Cohelan | 65,699 | 50.9 | |||
| Republican | John J. Allen, Jr. (incumbent) | 63,270 | 49.1 | |||
| Total votes | 128,969 | 100.0 | ||||
| Voter turnout | % | |||||
| Democratic gain from Republican | ||||||
1960
| Party | Candidate | Votes | % | |
|---|---|---|---|---|
| Democratic | Jeffery Cohelan (incumbent) | 79,776 | 57.1 | |
| Republican | Lewis F. Sherman | 60,065 | 42.9 | |
| Total votes | 139,841 | 100.0 | ||
| Voter turnout | % | |||
| Democratic hold | ||||
1962
| Party | Candidate | Votes | % | |
|---|---|---|---|---|
| Democratic | Jeffery Cohelan (incumbent) | 86,215 | 64.5 | |
| Republican | Leonard L. Cantando | 47,409 | 35.5 | |
| Total votes | 133,624 | 100.0 | ||
| Voter turnout | % | |||
| Democratic hold | ||||
1964
| Party | Candidate | Votes | % | |
|---|---|---|---|---|
| Democratic | Jeffery Cohelan (incumbent) | 100,901 | 66.1 | |
| Republican | Lawrence E. McNutt | 51,675 | 33.9 | |
| Total votes | 192,576 | 100.0 | ||
| Voter turnout | % | |||
| Democratic hold | ||||
1966
| Party | Candidate | Votes | % | |
|---|---|---|---|---|
| Democratic | Jeffery Cohelan (incumbent) | 84,644 | 64.4 | |
| Republican | Malcolm M. Champlin | 46,763 | 35.6 | |
| Total votes | 131,407 | 100.0 | ||
| Voter turnout | % | |||
| Democratic hold | ||||
1968
| Party | Candidate | Votes | % | |
|---|---|---|---|---|
| Democratic | Jeffery Cohelan (incumbent) | 102,108 | 62.9 | |
| Republican | Barney E. Hilburn | 48,133 | 29.6 | |
| Peace and Freedom | Huey P. Newton | 12,164 | 7.5 | |
| Total votes | 162,405 | 100.0 | ||
| Voter turnout | % | |||
| Democratic hold | ||||
1970
| Party | Candidate | Votes | % | |
|---|---|---|---|---|
| Democratic | Ron Dellums | 89,784 | 57.3 | |
| Republican | John E. Healy | 64,691 | 41.3 | |
| Peace and Freedom | Sarah Scahill | 2,156 | 1.4 | |
| Total votes | 156,631 | 100 | ||
| Voter turnout | % | |||
| Democratic hold | ||||
1972
| Party | Candidate | Votes | % | |
|---|---|---|---|---|
| Democratic | Ron Dellums (incumbent) | 126,351 | 60 | |
| Republican | Peter Hannaford | 85,851 | 38 | |
| American Independent | Frank V. Cortese | 13,430 | 2 | |
| Total votes | 225,632 | 100 | ||
| Voter turnout | % | |||
| Democratic hold | ||||
1974
| Party | Candidate | Votes | % | |
|---|---|---|---|---|
| Democratic | George Miller | 82,765 | 55.6 | |
| Republican | Gary Fernandez | 66,115 | 44.4 | |
| Total votes | 148,880 | 100.0 | ||
| Voter turnout | % | |||
| Democratic hold | ||||
1976
| Party | Candidate | Votes | % | |
|---|---|---|---|---|
| Democratic | George Miller (incumbent) | 147,064 | 74.7 | |
| Republican | Robert L. Vickers | 45,863 | 23.3 | |
| American Independent | Melvin E. Stanley | 3,889 | 2.0 | |
| Total votes | 196,816 | 100.0 | ||
| Voter turnout | % | |||
| Democratic hold | ||||
1978
| Party | Candidate | Votes | % | |
|---|---|---|---|---|
| Democratic | George Miller (incumbent) | 109,676 | 63.4 | |
| Republican | Paula Gordon | 58,332 | 33.7 | |
| American Independent | Melvin E. Stanley | 4,857 | 2.8 | |
| Total votes | 172,865 | 100.0 | ||
| Voter turnout | % | |||
| Democratic hold | ||||
1980
| Party | Candidate | Votes | % | |
|---|---|---|---|---|
| Democratic | George Miller (incumbent) | 142,044 | 63.3 | |
| Republican | Giles St. Clair | 70,479 | 31.4 | |
| Libertarian | Steve Snow | 6,923 | 3.1 | |
| American Independent | Thomas J. Thompson | 5,023 | 2.2 | |
| Total votes | 224,469 | 100.0 | ||
| Voter turnout | % | |||
| Democratic hold | ||||
1982
| Party | Candidate | Votes | % | |
|---|---|---|---|---|
| Democratic | George Miller (incumbent) | 126,952 | 67.2 | |
| Republican | Paul E. Vallely | 56,960 | 30.2 | |
| Libertarian | Richard Newell | 2,752 | 1.5 | |
| American Independent | Terry L. Wells | 2,205 | 1.2 | |
| Total votes | 188,869 | 100.0 | ||
| Voter turnout | % | |||
| Democratic hold | ||||
1984
| Party | Candidate | Votes | % | |
|---|---|---|---|---|
| Democratic | George Miller (incumbent) | 158,306 | 66.7 | |
| Republican | Rosemary Thaker | 78,985 | 33.3 | |
| Total votes | 237,291 | 100.0 | ||
| Voter turnout | % | |||
| Democratic hold | ||||
1986
| Party | Candidate | Votes | % | |
|---|---|---|---|---|
| Democratic | George Miller (incumbent) | 124,174 | 66.6 | |
| Republican | Rosemary Thaker | 62,379 | 33.4 | |
| Total votes | 186,553 | 100.0 | ||
| Voter turnout | % | |||
| Democratic hold | ||||
1988
| Party | Candidate | Votes | % | |
|---|---|---|---|---|
| Democratic | George Miller (incumbent) | 170,006 | 68.4 | |
| Republican | Jean Last | 78,478 | 31.6 | |
| Total votes | 248,484 | 100.0 | ||
| Voter turnout | % | |||
| Democratic hold | ||||
1990
| Party | Candidate | Votes | % | |
|---|---|---|---|---|
| Democratic | George Miller (incumbent) | 121,080 | 60.5 | |
| Republican | Roger A. Payton | 79,031 | 39.5 | |
| Total votes | 200,111 | 100.0 | ||
| Voter turnout | % | |||
| Democratic hold | ||||
1992
| Party | Candidate | Votes | % | |
|---|---|---|---|---|
| Democratic | George Miller (incumbent) | 153,320 | 70.3 | |
| Republican | Dave Scholl | 54,822 | 25.2 | |
| Peace and Freedom | David L. Franklin | 9,840 | 4.5 | |
| Total votes | 217,982 | 100.0 | ||
| Voter turnout | % | |||
| Democratic hold | ||||
1994
| Party | Candidate | Votes | % | |
|---|---|---|---|---|
| Democratic | George Miller (incumbent) | 116,015 | 69.69 | |
| Republican | Charles V. Hughes | 45,698 | 27.43 | |
| Peace and Freedom | William A. "Bill" Callison | 4,798 | 2.88 | |
| Total votes | 166,601 | 100.0 | ||
| Voter turnout | % | |||
| Democratic hold | ||||
1996
| Party | Candidate | Votes | % | |
|---|---|---|---|---|
| Democratic | George Miller (incumbent) | 137,089 | 71.9 | |
| Republican | Norman Reece | 42,542 | 22.3 | |
| Reform | William Thompson | 6,866 | 3.5 | |
| Natural Law | Bruce Kendall | 4,420 | 2.3 | |
| Total votes | 190,917 | 100.0 | ||
| Voter turnout | % | |||
| Democratic hold | ||||
1998
| Party | Candidate | Votes | % | |
|---|---|---|---|---|
| Democratic | George Miller (incumbent) | 125,842 | 76.67 | |
| Republican | Norman H. Reece | 38,290 | 23.33 | |
| Total votes | 164,132 | 100.0 | ||
| Voter turnout | % | |||
| Democratic hold | ||||
2000
| Party | Candidate | Votes | % | |
|---|---|---|---|---|
| Democratic | George Miller (incumbent) | 159,692 | 76.5 | |
| Republican | Christopher A. Hoffman | 44,154 | 21.2 | |
| Natural Law | Martin Sproul | 4,943 | 2.3 | |
| Total votes | 208,789 | 100.0 | ||
| Voter turnout | % | |||
| Democratic hold | ||||
2002
| Party | Candidate | Votes | % | |
|---|---|---|---|---|
| Democratic | George Miller (incumbent) | 97,849 | 70.8 | |
| Republican | Charles R. Hargrave | 36,584 | 26.4 | |
| Libertarian | Scott A. Wilson | 3,943 | 2.8 | |
| Total votes | 138,376 | 100.0 | ||
| Voter turnout | % | |||
| Democratic hold | ||||
2004
| Party | Candidate | Votes | % | |
|---|---|---|---|---|
| Democratic | George Miller (incumbent) | 166,831 | 76.1 | |
| Republican | Charles Hargrave | 52,446 | 23.9 | |
| Total votes | 219,277 | 100.0 | ||
| Voter turnout | % | |||
| Democratic hold | ||||
2006
| Party | Candidate | Votes | % | |
|---|---|---|---|---|
| Democratic | George Miller (incumbent) | 118,000 | 84.0 | |
| Libertarian | Camden McConnell | 22,486 | 16.0 | |
| Total votes | 140,486 | 100.0 | ||
| Voter turnout | % | |||
| Democratic hold | ||||
2008
| Party | Candidate | Votes | % | |
|---|---|---|---|---|
| Democratic | George Miller (incumbent) | 170,962 | 72.82 | |
| Republican | Roger Allen Petersen | 51,166 | 21.79 | |
| Peace and Freedom | Bill Callison | 6,695 | 2.85 | |
| Libertarian | Camden McConnell | 5,950 | 2.53 | |
| Total votes | 234,773 | 100.0 | ||
| Voter turnout | % | |||
| Democratic hold | ||||
2010
| Party | Candidate | Votes | % | |
|---|---|---|---|---|
| Democratic | George Miller (incumbent) | 122,435 | 68% | |
| Republican | Rick Tubbs | 56,764 | 32% | |
| Total votes | 179,199 | 100% | ||
| Voter turnout | % | |||
| Democratic hold | ||||
2012
| Party | Candidate | Votes | % | |||
|---|---|---|---|---|---|---|
| Democratic | Ami Bera | 141,241 | 52% | |||
| Republican | Dan Lungren (incumbent) | 132,050 | 48% | |||
| Total votes | 273,291 | 100% | ||||
| Voter turnout | % | |||||
| Democratic gain from Republican | ||||||
2014
| Party | Candidate | Votes | % | |
|---|---|---|---|---|
| Democratic | Ami Bera (incumbent) | 92,521 | 50% | |
| Republican | Doug Ose | 91,066 | 50% | |
| Total votes | 183,587 | 100% | ||
| Voter turnout | % | |||
| Democratic hold | ||||
2016
| Party | Candidate | Votes | % | |
|---|---|---|---|---|
| Democratic | Ami Bera (incumbent) | 129,064 | 51.2% | |
| Republican | Scott Jones | 123,056 | 48.8% | |
| Total votes | 252,120 | 100.00% | ||
| Voter turnout | % | |||
| Democratic hold | ||||
Living former Members
As of April 2015, there are two former members of the U.S. House of Representatives from California's 7th congressional district that are currently living.
| Representative | Term in office | Date of birth (and age) |
|---|---|---|
| Ron Dellums | 1971 - 1975 | November 24, 1935 |
| George Miller | 1975 - 2013 | May 17, 1945 |
Historical district boundaries
See also
References
- ↑ "California election results - 2012 election". Los Angeles Times. Retrieved February 24, 2013.
- ↑ "Maps: Final Congressional Districts". Citizens Redistricting Commission. Retrieved February 24, 2013.
- ↑ Statement of Vote (2000 President)
- ↑ Statement of Vote (2000 Senator)
- ↑ Statement of Vote (2002 Governor)
- ↑ Statement of Vote (2003 Recall Question)
- ↑ Statement of Vote (2003 Governor)
- ↑ Statement of Vote (2004 President)
- ↑ Statement of Vote (2004 Senator)
- ↑ Statement of Vote (2006 Governor)
- ↑ Statement of Vote (2006 Senator)
- ↑ (2008 President)
- ↑
- ↑ 1920 election results
- ↑ 1922 election results
- ↑ 1924 election results
- ↑ 1926 election results
- ↑ 1928 election results
- ↑ 1930 election results
- ↑ 1932 election results
- ↑ 1934 election results
- ↑ 1936 election results
- ↑ 1938 election results
- ↑ 1940 election results
- ↑ 1942 election results
- ↑ 1944 election results
- ↑ 1946 election results
- ↑ 1948 election results
- ↑ 1950 election results
- ↑ 1952 election results
- ↑ 1954 election results
- ↑ 1956 election results
- ↑ 1958 election results
- ↑ 1960 election results
- ↑ 1962 election results
- ↑ 1964 election results
- ↑ 1966 election results
- ↑ 1968 election results
- ↑ 1970 election results
- ↑ 1972 election results
- ↑ 1974 election results
- ↑ 1976 election results
- ↑ 1978 election results
- ↑ 1980 election results
- ↑ 1982 election results
- ↑ 1984 election results
- ↑ 1986 election results
- ↑ 1988 election results
- ↑ 1990 election results
- ↑ 1992 election results
- ↑ 1994 election results
- ↑ 1996 election results
- ↑ 1998 election results
- ↑ 2000 election results
- ↑ 2002 general election results Archived February 3, 2009, at the Wayback Machine.
- ↑ 2004 general election results
- ↑ 2006 general election results Archived November 27, 2008, at the Wayback Machine.
- ↑ 2008 general election results
- ↑ 2010 general election results
- ↑ 2010 general election results
External links
- GovTrack.us: California's 7th congressional district
Coordinates: 38°29′N 121°18′W / 38.49°N 121.3°W