California's 5th congressional district
| California's 5th congressional district | ||
|---|---|---|
.tif.png) | ||
| Current Representative | Mike Thompson (D–St. Helena) | |
| Ethnicity | 52.8% White, 7% Black, 12.1% Asian, 25.7% Hispanic, 2.4[1]% other | |
| Cook PVI | D+19 | |
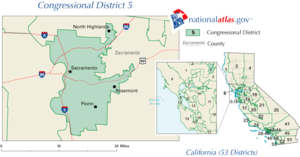
California's 5th congressional district is a congressional district in the U.S. state of California.
Mike Thompson, a Democrat, has represented the district since January 2013.
Currently, the 5th district encompasses much of California's wine country. It consists of Napa County plus portions of Contra Costa, Lake, Solano, and Sonoma counties.
Cities in the district include Cotati, Rohnert Park, Santa Rosa, Sonoma, Napa, American Canyon, Vallejo, Benicia, Hercules, and part of Martinez.[2]
Prior to redistricting by the California Citizens Redistricting Commission of 2011, the 5th District encompassed the city of Sacramento and some of the Sacramento metropolitan area, while most of the territory now in the 5th District had formerly been the 1st District.
One of the main characters of the Netflix original series House of Cards, Jackie Sharp, is depicted as representing the district in the United States House of Representatives.
Competitiveness
John Kerry won the district in 2004 with 61.1% of the vote. The district swung more into the Democratic column in 2008 when Barack Obama won 69.62% of the vote while John McCain received 28.40%.
Election results from recent statewide races
| Year | U.S. President | U.S. Senator (Class 1) | U.S. Senator (Class 3) | Governor |
|---|---|---|---|---|
| 1992 | Clinton (D) 50.9 - 31.1% | Feinstein (D) 59.8 - 32.6% | Boxer (D) 55.2 - 35.3% | — |
| 1994 | — | [Data unknown/missing. You can help!] | — | Brown (D) 48.6 - 47.2% |
| 1996 | Clinton (D) 57.1 - 33.8% | — | — | — |
| 1998 | — | — | [Data unknown/missing. You can help!] | [Data unknown/missing. You can help!] |
| 2000 | Gore (D) 57.1 - 37.0%[3] | Feinstein (D) 61.6 - 31.1%[4] | — | — |
| 2002 | — | — | — | Davis (D) 50.4 - 35.3%[5] |
| 2003 | — | — | — | Recall: |
| Schwarzenegger (R) 43.1 - 35.4% | ||||
| 2004 | Kerry (R) 61.1 - 37.9%[8] | — | Boxer (D) 68.3 - 27.5%[9] | — |
| 2006 | — | Feinstein (D) 66.7 - 27.1%[10] | — | Schwarzenegger (R) 49.6 - 43.8% |
| 2008 | Obama (D) 69.6 - 28.4%[11] | — | — | — |
| 2010 | — | — | Boxer (D) 62.2 - 33.3%[12] | Brown (D) 68.1 - 27.1%[13] |
| 2012 | [Data unknown/missing. You can help!] | [Data unknown/missing. You can help!] | — | — |
| 2014 | — | — | — | [Data unknown/missing. You can help!] |
List of representatives
| Representative | Party | Years | Notes | Counties |
|---|---|---|---|---|
| District created | March 4, 1885 | |||
 Charles N. Felton Charles N. Felton |
Republican | March 4, 1885 – March 3, 1889 |
First elected in 1884. Retired. |
San Francisco, San Mateo, Santa Clara, Santa Cruz |
 Thomas J. Clunie Thomas J. Clunie |
Democratic | March 4, 1889 – March 3, 1891 |
Elected in 1888. Retired. | |
 Eugene F. Loud Eugene F. Loud |
Republican | March 4, 1891 – March 3, 1893 |
First elected in 1890. Lost re-election. | |
| March 4, 1893 – March 3, 1903 |
San Francisco, San Mateo, Santa Clara | |||
.jpg) William J. Wynn William J. Wynn |
Democratic- Union Labor |
March 4, 1903 – March 3, 1905 |
Elected in 1902. Lost re-election. | |
 Everis A. Hayes Everis A. Hayes |
Republican | March 4, 1905 – March 3, 1913 |
First elected in 1904. Redistricted to the 8th district. | |
 John I. Nolan John I. Nolan |
Republican | March 4, 1913 – November 18, 1922 |
First elected in 1912. Died. |
San Francisco |
| Vacant | November 18, 1922 – January 23, 1923 |
|||
 Mae Nolan Mae Nolan |
Republican | January 23, 1923 – March 3, 1925 |
First elected to finish her husband's term. Retired. | |
.jpg) Lawrence J. Flaherty Lawrence J. Flaherty |
Republican | March 4, 1925 – June 13, 1926 |
Elected in 1924. Died. | |
| Vacant | June 13, 1926 – August 31, 1926 |
|||
.jpg) Richard J. Welch Richard J. Welch |
Republican | August 31, 1926 – September 10, 1949 |
First elected to finish Flaherty's term. Died. | |
| Vacant | September 10, 1949 – November 8, 1949 |
|||
 John F. Shelley John F. Shelley |
Democratic | November 8, 1949 – January 7, 1964 |
First elected in 1948. Resigned to become Mayor of San Francisco. | |
| Vacant | January 7, 1964 – February 18, 1964 |
|||
 Phillip Burton Phillip Burton |
Democratic | February 18, 1964 – January 3, 1967 |
First elected to finish Shelley's term. Redistricted to the 6th district. | |
| January 3, 1967 – January 3, 1975 |
Eastern San Francisco | |||
 John L. Burton John L. Burton |
Democratic | January 3, 1975 – January 3, 1983 |
Redistricted from the 6th district. Retired. |
Marin, northwestern San Francisco |
| Phillip Burton |
Democratic | January 3, 1983 – April 10, 1983 |
Redistricted from the 6th district. Died. |
Western San Francisco |
| Vacant | April 10, 1983 – June 21, 1983 |
|||
 Sala Burton Sala Burton |
Democratic | June 21, 1983 – February 1, 1987 |
First elected to finish her husband's term. Died. | |
| Vacant | February 1, 1987 – June 2, 1987 |
|||
 Nancy Pelosi Nancy Pelosi |
Democratic | June 2, 1987 – January 3, 1993 |
First elected to finish Burton's term. Redistricted to the 8th district. | |
 Bob Matsui Bob Matsui |
Democratic | January 3, 1993 – January 3, 2003 |
Redistricted from the 3rd district. Died. |
Sacramento (Sacramento city) |
| January 3, 2003 – January 1, 2005 |
 Sacramento (Sacramento city) | |||
| Vacant | January 1, 2005 – March 10, 2005 |
|||
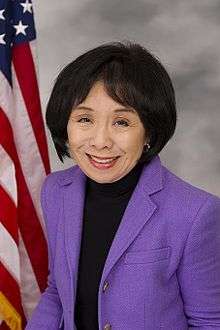 Doris Matsui Doris Matsui |
Democratic | March 8, 2005 – January 3, 2013 |
First elected to finish her husband's term. Redistricted to the 6th district.. | |
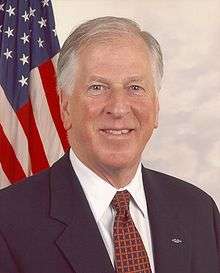 Mike Thompson Mike Thompson |
Democratic | January 3, 2013 – present |
Redistricted from the 1st district. Re-elected in 2014. |
North Bay area including Napa, Santa Rosa, and Vallejo |
Complete election results
1884
| Party | Candidate | Votes | % | |||
|---|---|---|---|---|---|---|
| Republican | Charles N. Felton | 17,014 | 51.7 | |||
| Democratic | Frank J. Sullivan | 15,676 | 47.6 | |||
| Prohibition | William Crowhurst | 232 | 0.7 | |||
| Total votes | 32,922 | 100.0 | ||||
| Voter turnout | % | |||||
| Republican gain from Democratic | ||||||
1886
| Party | Candidate | Votes | % | |
|---|---|---|---|---|
| Republican | Charles N. Felton (inc.) | 16,328 | 48.8 | |
| Democratic | Frank J. Sullivan | 16,209 | 48.4 | |
| Independent | Albert E. Redstone | 470 | 1.4 | |
| Prohibition | C. Henderson | 460 | 1.4 | |
| Total votes | 33,467 | 100.0 | ||
| Voter turnout | % | |||
| Republican hold | ||||
1888
| Party | Candidate | Votes | % | |||
|---|---|---|---|---|---|---|
| Democratic | Thomas J. Clunie | 20,276 | 49.3 | |||
| Republican | Timothy Guy Phelps | 20,225 | 49.2 | |||
| Independent | Henry French | 613 | 1.5 | |||
| Total votes | 41,114 | 100.0 | ||||
| Voter turnout | % | |||||
| Democratic gain from Republican | ||||||
1890
| Party | Candidate | Votes | % | |||
|---|---|---|---|---|---|---|
| Republican | Eugene F. Loud | 22,871 | 52.8 | |||
| Democratic | Thomas J. Clunie (incumbent) | 19,899 | 45.9 | |||
| Socialist | E. F. Howe | 574 | 1.3 | |||
| Total votes | 43,344 | 100.0 | ||||
| Voter turnout | % | |||||
| Republican gain from Democratic | ||||||
1892
| Party | Candidate | Votes | % | |
|---|---|---|---|---|
| Republican | Eugene F. Loud (incumbent) | 14,660 | 46.4 | |
| Democratic | J. W. Ryland | 13,694 | 43.3 | |
| Populist | Jonas J. Morrison | 2,484 | 7.9 | |
| Prohibition | William Kelly | 771 | 2.4 | |
| Total votes | 31,609 | 100.0 | ||
| Voter turnout | % | |||
| Republican hold | ||||
1894
| Party | Candidate | Votes | % | |
|---|---|---|---|---|
| Republican | Eugene F. Loud (incumbent) | 13,379 | 36.8 | |
| Democratic | Joseph P. Kelly | 8,384 | 23.0 | |
| Populist | James T. Rogers | 7,820 | 21.5 | |
| Prohibition | James Denman | 6,811 | 18.7 | |
| Total votes | 36,394 | 100.0 | ||
| Voter turnout | % | |||
| Democratic hold | ||||
1896
| Party | Candidate | Votes | % | |
|---|---|---|---|---|
| Republican | Eugene F. Loud (incumbent) | 19,351 | 48.6 | |
| Democratic | Joseph P. Kelly | 10,494 | 26.3 | |
| Populist | A. B. Kinne | 8,825 | 22.2 | |
| Socialist Labor | Henry Daniels | 757 | 1.9 | |
| Prohibition | T. H. Lawson | 404 | 1.0 | |
| Total votes | 39,831 | 100.0 | ||
| Voter turnout | % | |||
| Republican hold | ||||
1898
| Party | Candidate | Votes | % | |
|---|---|---|---|---|
| Republican | Eugene F. Loud (incumbent) | 20,254 | 51.8 | |
| Democratic | William Craig | 17,352 | 44.3 | |
| Socialist Labor | E. T. Kingsley | 1,532 | 3.9 | |
| Total votes | 39,138 | 100.0 | ||
| Voter turnout | % | |||
| Republican hold | ||||
1900
| Party | Candidate | Votes | % | |
|---|---|---|---|---|
| Republican | Eugene F. Loud (incumbent) | 23,443 | 55.7 | |
| Democratic | J. H. Henry | 17,365 | 41.3 | |
| Socialist | C. H. King | 942 | 2.2 | |
| Prohibition | Fred E. Caton | 322 | 0.8 | |
| Total votes | 42,072 | 100.0 | ||
| Voter turnout | % | |||
| Republican hold | ||||
1902
| Party | Candidate | Votes | % | |||
|---|---|---|---|---|---|---|
| Democratic | William J. Wynn | 22,712 | 56.5 | |||
| Republican | Eugene F. Loud (incumbent) | 16,577 | 41.2 | |||
| Socialist | Joseph Lawrence | 620 | 1.5 | |||
| Prohibition | Fred E. Caton | 301 | 0.8 | |||
| Total votes | 40,210 | 100.0 | ||||
| Voter turnout | % | |||||
| Democratic gain from Republican | ||||||
1904
| Party | Candidate | Votes | % | |||
|---|---|---|---|---|---|---|
| Republican | Everis A. Hayes | 23,701 | 52.3 | |||
| Democratic | William J. Wynn (incumbent) | 18,025 | 39.7 | |||
| style="background-color: Template:Union Labor Party (California)/meta/color; width: 2px;" | | Template:Union Labor Party (California)/meta/shortname | F. R. Whitney | 2,263 | 5.0 | ||
| Socialist | Charles J. Williams | 916 | 2.0 | |||
| Prohibition | George B. Pratt | 445 | 1.0 | |||
| Total votes | 45,350 | 100.0 | ||||
| Voter turnout | % | |||||
| Republican gain from Democratic | ||||||
1906
| Party | Candidate | Votes | % | |
|---|---|---|---|---|
| Republican | Everis A. Hayes (incumbent) | 22,530 | 53.4 | |
| Democratic | Hiram G. Davis | 17,295 | 41.0 | |
| Socialist | Joseph Lawrence | 2,343 | 5.6 | |
| Total votes | 42,168 | 100.0 | ||
| Voter turnout | % | |||
| Republican hold | ||||
1908
| Party | Candidate | Votes | % | |
|---|---|---|---|---|
| Republican | Everis A. Hayes (incumbent) | 28,127 | 49.1 | |
| Democratic | George A. Tracy | 24,531 | 42.8 | |
| Socialist | E. H. Misner | 3,640 | 6.3 | |
| Prohibition | Walter E. Vail | 1,045 | 1.8 | |
| Total votes | 57,343 | 100.0 | ||
| Voter turnout | % | |||
| Republican hold | ||||
1910
| Party | Candidate | Votes | % | |
|---|---|---|---|---|
| Republican | Everis A. Hayes (incumbent) | 33,265 | 59.4 | |
| Democratic | Thomas E. Hayden | 15,345 | 27.4 | |
| Socialist | E. L. Reguin | 7,052 | 12.6 | |
| Prohibition | T. E. Caton | 359 | 0.6 | |
| Total votes | 56,021 | 100.0 | ||
| Voter turnout | % | |||
| Republican hold | ||||
1912
| Party | Candidate | Votes | % | ||
|---|---|---|---|---|---|
| Republican | John I. Nolan | 27,902 | 52.3 | ||
| Socialist | Stephen V. Costello | 18,516 | 34.7 | ||
| Prohibition | E. L. Requin | 6,962 | 13.0 | ||
| Total votes | 53,380 | 100.0 | |||
| Voter turnout | % | ||||
| Republican win (new seat) | |||||
1914
| Party | Candidate | Votes | % | |
|---|---|---|---|---|
| Republican | John I. Nolan (incumbent) | 53,875 | 83.3 | |
| Socialist | Mads Peter Christensen | 7,366 | 11.4 | |
| Prohibition | Frederick Head | 3,410 | 5.3 | |
| Total votes | 64,651 | 100.0 | ||
| Voter turnout | % | |||
| Republican hold | ||||
1916
| Party | Candidate | Votes | % | |
|---|---|---|---|---|
| Republican | John I. Nolan (incumbent) | 59,333 | 84.7 | |
| Socialist | Charles A. Preston | 6,708 | 9.6 | |
| Prohibition | Frederick Head | 4,046 | 5.8 | |
| Total votes | 70,087 | 100.0 | ||
| Voter turnout | % | |||
| Republican hold | ||||
1918
| Party | Candidate | Votes | % | |
|---|---|---|---|---|
| Republican | John I. Nolan (incumbent) | 40,375 | 87 | |
| Socialist | Thomas F. Feeley | 6,032 | 13 | |
| Total votes | 46,407 | 100.0 | ||
| Voter turnout | % | |||
| Republican hold | ||||
1920
| Party | Candidate | Votes | % | |
|---|---|---|---|---|
| Republican | John I. Nolan (incumbent) | 50,274 | 81.8 | |
| Socialist | Hugo Ernst | 10,952 | 18.2 | |
| Total votes | 61,226 | 100.0 | ||
| Voter turnout | % | |||
| Republican hold | ||||
1922
| Party | Candidate | Votes | % | |
|---|---|---|---|---|
| Republican | John I. Nolan (incumbent) | 49,414 | 100.0 | |
| Voter turnout | % | |||
| Republican hold | ||||
1923 (Special)
Republican Mae Nolan won the special election to replace her husband John I. Nolan, who won re-election but died before the 68th Congress convened. Data for this special election is not available.[16]
1924
| Party | Candidate | Votes | % | |
|---|---|---|---|---|
| Republican | Lawrence J. Flaherty | 38,893 | 72.6 | |
| Socialist | Isabel C. King | 12,175 | 27.4 | |
| Total votes | 51,068 | 100.0 | ||
| Voter turnout | % | |||
| Republican hold | ||||
1926 (Special)
Republican Richard J. Welch won the special election to replace fellow Republican Lawrence J. Flaherty, who died in office. Data for this special election is not available.[18]
1926
| Party | Candidate | Votes | % | |
|---|---|---|---|---|
| Republican | Richard J. Welch (incumbent) | 47,694 | 100.0 | |
| Voter turnout | % | |||
| Republican hold | ||||
1928
| Party | Candidate | Votes | % | |
|---|---|---|---|---|
| Republican | Richard J. Welch (incumbent) | 51,708 | 100.0 | |
| Voter turnout | % | |||
| Republican hold | ||||
1930
| Party | Candidate | Votes | % | |
|---|---|---|---|---|
| Republican | Richard J. Welch (incumbent) | 59,853 | 100.0 | |
| Voter turnout | % | |||
| Republican hold | ||||
1932
| Party | Candidate | Votes | % | |
|---|---|---|---|---|
| Republican | Richard J. Welch (incumbent) | 67,349 | 100.0 | |
| Voter turnout | % | |||
| Republican hold | ||||
1934
| Party | Candidate | Votes | % | |
|---|---|---|---|---|
| Republican | Richard J. Welch (incumbent) | 89,751 | 93.8 | |
| Communist | Alexander Noral | 5,933 | 6.2 | |
| Total votes | 95,684 | 100.0 | ||
| Voter turnout | % | |||
| Republican hold | ||||
1936
| Party | Candidate | Votes | % | |
|---|---|---|---|---|
| Republican | Richard J. Welch (incumbent) | 82,910 | 94.8 | |
| Communist | Lawrence Ross | 4,545 | 5.2 | |
| Total votes | 87,455 | 100.0 | ||
| Voter turnout | % | |||
| Republican hold | ||||
1938
| Party | Candidate | Votes | % | |
|---|---|---|---|---|
| Republican | Richard J. Welch (incumbent) | 91,868 | 100.0 | |
| Voter turnout | % | |||
| Republican hold | ||||
1940
| Party | Candidate | Votes | % | |
|---|---|---|---|---|
| Republican | Richard J. Welch (incumbent) | 119,122 | 95.8 | |
| Communist | Walter R. Lambert | 5,232 | 4.2 | |
| Total votes | 124,354 | 100.0 | ||
| Voter turnout | % | |||
| Republican hold | ||||
1942
| Party | Candidate | Votes | % | |
|---|---|---|---|---|
| Republican | Richard J. Welch (incumbent) | 85,747 | 92.7 | |
| Communist | Walter R. Lambert | 6,749 | 7.3 | |
| Total votes | 92,496 | 100.0 | ||
| Voter turnout | % | |||
| Republican hold | ||||
1944
| Party | Candidate | Votes | % | |
|---|---|---|---|---|
| Republican | Richard J. Welch (incumbent) | 112,151 | 100.0 | |
| Voter turnout | % | |||
| Republican hold | ||||
1946
| Party | Candidate | Votes | % | |
|---|---|---|---|---|
| Republican | Richard J. Welch (incumbent) | 94,293 | 100.0 | |
| Voter turnout | % | |||
| Republican hold | ||||
1948
| Party | Candidate | Votes | % | |
|---|---|---|---|---|
| Republican | Richard J. Welch (incumbent) | 116,347 | 100.0 | |
| Voter turnout | % | |||
| Republican hold | ||||
1949 (Special)
Democrat John F. Shelley won the special election to replace Republican Richard J. Welch, who died in office. Data for this special election is not available.[31]
1950
| Party | Candidate | Votes | % | |
|---|---|---|---|---|
| Democratic | John F. Shelley (incumbent) | 117,888 | 100.0 | |
| Voter turnout | % | |||
| Democratic hold | ||||
1952
| Party | Candidate | Votes | % | |
|---|---|---|---|---|
| Democratic | John F. Shelley (incumbent) | 107,542 | 100.0 | |
| Voter turnout | % | |||
| Democratic hold | ||||
1954
| Party | Candidate | Votes | % | |
|---|---|---|---|---|
| Democratic | John F. Shelley (incumbent) | 86,428 | 100.0 | |
| Voter turnout | % | |||
| Democratic hold | ||||
1956
| Party | Candidate | Votes | % | |
|---|---|---|---|---|
| Democratic | John F. Shelley (incumbent) | 104,358 | 100.0 | |
| Voter turnout | % | |||
| Democratic hold | ||||
1958
| Party | Candidate | Votes | % | |
|---|---|---|---|---|
| Democratic | John F. Shelley (incumbent) | 99,171 | 100.0 | |
| Voter turnout | % | |||
| Democratic hold | ||||
1960
| Party | Candidate | Votes | % | |
|---|---|---|---|---|
| Democratic | John F. Shelley (incumbent) | 104,507 | 83.7 | |
| Republican | Vick Verreos | 20,305 | 16.3 | |
| Total votes | 124,812 | 100.0 | ||
| Voter turnout | % | |||
| Democratic hold | ||||
1962
| Party | Candidate | Votes | % | |
|---|---|---|---|---|
| Democratic | John F. Shelley (incumbent) | 64,493 | 80.4 | |
| Republican | Roland S. Charles | 15,670 | 19.6 | |
| Total votes | 80,163 | 100.0 | ||
| Voter turnout | % | |||
| Democratic hold | ||||
1964
| Party | Candidate | Votes | % | |
|---|---|---|---|---|
| Democratic | Phillip Burton (incumbent) | 71,638 | 100.0 | |
| Voter turnout | % | |||
| Democratic hold | ||||
1966
| Party | Candidate | Votes | % | |
|---|---|---|---|---|
| Democratic | Phillip Burton (incumbent) | 56,476 | 71.3 | |
| Republican | Terry R. Macken | 22,778 | 28.7 | |
| Total votes | 79,254 | 100.0 | ||
| Voter turnout | % | |||
| Democratic hold | ||||
1968
| Party | Candidate | Votes | % | |
|---|---|---|---|---|
| Democratic | Phillip Burton (incumbent) | 86,647 | 72.0 | |
| Republican | Waldo Velasquez | 29,123 | 24.2 | |
| Peace and Freedom | Marvin Garson | 4,549 | 3.8 | |
| Total votes | 120,319 | 100.0 | ||
| Voter turnout | % | |||
| Democratic hold | ||||
1970
| Party | Candidate | Votes | % | |
|---|---|---|---|---|
| Democratic | Phillip Burton (incumbent) | 76,567 | 70.8 | |
| Republican | John E. Parks | 31,570 | 29.2 | |
| Total votes | 108,137 | 100.0 | ||
| Voter turnout | % | |||
| Democratic hold | ||||
1972
| Party | Candidate | Votes | % | |
|---|---|---|---|---|
| Democratic | Phillip Burton (incumbent) | 120,819 | 81.8 | |
| Republican | Edlo E. Powell | 26,963 | 18.2 | |
| Total votes | 147,782 | 100.0 | ||
| Voter turnout | % | |||
| Democratic hold | ||||
1974
| Party | Candidate | Votes | % | |
|---|---|---|---|---|
| Democratic | John L. Burton (incumbent) | 87,323 | 59.6 | |
| Republican | Thomas Caylor | 55,881 | 37.7 | |
| Peace and Freedom | Raymond Broshears | 3,999 | 2.7 | |
| Total votes | 147,203 | 100.0 | ||
| Voter turnout | % | |||
| Democratic hold | ||||
1976
| Party | Candidate | Votes | % | |
|---|---|---|---|---|
| Democratic | John L. Burton (incumbent) | 103,746 | 61.8 | |
| Republican | Branwell Fanning | 64,008 | 38.2 | |
| Total votes | 167,754 | 100.0 | ||
| Voter turnout | % | |||
| Democratic hold | ||||
1978
| Party | Candidate | Votes | % | |
|---|---|---|---|---|
| Democratic | John L. Burton (incumbent) | 106,046 | 66.8 | |
| Republican | Dolores Skore | 52,603 | 33.2 | |
| Total votes | 158,649 | 100.0 | ||
| Voter turnout | % | |||
| Democratic hold | ||||
1980
| Party | Candidate | Votes | % | |
|---|---|---|---|---|
| Democratic | John L. Burton (incumbent) | 101,105 | 51.1 | |
| Republican | Dennis McQuaid | 89,624 | 45.3 | |
| Libertarian | Dan P. Dougherty | 7,092 | 3.6 | |
| Total votes | 197,821 | 100.0 | ||
| Voter turnout | % | |||
| Democratic hold | ||||
1982
| Party | Candidate | Votes | % | |
|---|---|---|---|---|
| Democratic | Phillip Burton (incumbent) | 103,268 | 50.5 | |
| Republican | Milton Marks | 72,139 | 35.3 | |
| Libertarian | Justin Raimondo | 2,904 | 14.2 | |
| Total votes | 178,311 | 100.0 | ||
| Voter turnout | % | |||
| Democratic hold | ||||
1983 (Special)
| Party | Candidate | Votes | % | |
|---|---|---|---|---|
| Democratic | Sala Burton | ' | 56.9 | |
| Republican | Duncan Lent Howard | 23.3 | ||
| Democratic | Richard Doyle | 8.4 | ||
| Republican | Tom Spinosa | 3.7 | ||
| Republican | Gary Richard Arnold | 2.0 | ||
| Democratic | Tibor Uskert | 1.4 | ||
| Republican | Bill Dunlap | 1.3 | ||
| Democratic | Evelyn K. Lantz | 1.1 | ||
| Democratic | Michael O. Plunkett | 0.7 | ||
| Peace and Freedom | Andrew R. "Paul" Kangas | 0.6 | ||
| Libertarian | Eric A. Garris | 0.5 | ||
| No party | Richard Stypman (Write-in) | % | ||
| No party | Samuel Unger (write-in) | % | ||
| Total votes | ' | 100.0 | ||
| Voter turnout | % | |||
| Democratic hold | ||||
1984
| Party | Candidate | Votes | % | |
|---|---|---|---|---|
| Democratic | Sala Burton (incumbent) | 139,692 | 72.3 | |
| Republican | Tom Spinosa | 45,930 | 23.8 | |
| Libertarian | Joseph Fuhrig | 4,008 | 2.1 | |
| Peace and Freedom | Henry Clark | 3,574 | 1.8 | |
| Total votes | 193,204 | 100.0 | ||
| Voter turnout | % | |||
| Democratic hold | ||||
1986
| Party | Candidate | Votes | % | |
|---|---|---|---|---|
| Democratic | Sala Burton (incumbent) | 122,688 | 75.2 | |
| Republican | Mike Garza | 36,039 | 22.1 | |
| Libertarian | Samuel K. "Sam" Grove | 2,409 | 1.5 | |
| Peace and Freedom | Theodore Adrian "Ted" Zuur | 2,078 | 1.3 | |
| Total votes | 163,214 | 100.0 | ||
| Voter turnout | % | |||
| Democratic hold | ||||
1987 (Special)
| Party | Candidate | Votes | % | |
|---|---|---|---|---|
| Democratic | Nancy Pelosi | ' | 63.4 | |
| Republican | Harriet Ross | 23.3 | ||
| Independent | Karen Edwards | 2.2 | ||
| Independent | Cathy Sedwick | 0.9 | ||
| Peace and Freedom | Theodore Adrian "Ted" Zurr | 1.5 | ||
| Libertarian | Samuel K. "Sam" Grove | 1.4 | ||
| Total votes | ' | 100.0 | ||
| Voter turnout | % | |||
| Democratic hold | ||||
1988
| Party | Candidate | Votes | % | |
|---|---|---|---|---|
| Democratic | Nancy Pelosi (incumbent) | 133,530 | 76.4 | |
| Republican | Bruce Michael O'Neill | 33,692 | 19.3 | |
| Peace and Freedom | Theodore Adrian "Ted" Zuur | 3,975 | 2.3 | |
| Libertarian | Sam Grove | 3,561 | 2.0 | |
| Total votes | 174,758 | 100.0 | ||
| Voter turnout | % | |||
| Democratic hold | ||||
1990
| Party | Candidate | Votes | % | |
|---|---|---|---|---|
| Democratic | Nancy Pelosi (incumbent) | 120,633 | 77.2 | |
| Republican | Alan Nichols | 35,671 | 22.8 | |
| Total votes | 156,304 | 100.0 | ||
| Voter turnout | % | |||
| Democratic hold | ||||
1992
| Party | Candidate | Votes | % | |
|---|---|---|---|---|
| Democratic | Robert Matsui (incumbent) | 158,250 | 68.6 | |
| Republican | Robert S. Dinsmore | 58,698 | 25.5 | |
| American Independent | Gordon Mors | 4,745 | 2.1 | |
| Libertarian | Chris J. Rufer | 4,547 | 2.0 | |
| Green | Tian Harter | 4,316 | 1.9 | |
| No party | Bergeron (write-in) | 4 | 0.0% | |
| Total votes | 230,560 | 100.0 | ||
| Voter turnout | % | |||
| Democratic hold | ||||
1994
| Party | Candidate | Votes | % | |
|---|---|---|---|---|
| Democratic | Robert Matsui (incumbent) | 125,042 | 68.48 | |
| Republican | Robert S. Dinsmore | 52,905 | 28.97 | |
| American Independent | Gordon Mors | 4,649 | 2.55 | |
| Total votes | 182,596 | 100.0 | ||
| Voter turnout | % | |||
| Democratic hold | ||||
1996
| Party | Candidate | Votes | % | |
|---|---|---|---|---|
| Democratic | Robert Matsui (incumbent) | 142,618 | 70.5 | |
| Republican | Robert Dinsmore | 52,940 | 26.2 | |
| Libertarian | Joseph Miller | 2,548 | 1.2 | |
| American Independent | Gordon Mors | 2,231 | 1.1 | |
| Natural Law | Charles Kersey | 2,123 | 1.0 | |
| Total votes | 202,460 | 100.0 | ||
| Voter turnout | % | |||
| Democratic hold | ||||
1998
| Party | Candidate | Votes | % | |
|---|---|---|---|---|
| Democratic | Robert Matsui (incumbent) | 130,715 | 71.89 | |
| Republican | Robert Dinsmore | 47,307 | 26.02 | |
| Libertarian | Douglas Arthur Tuma | 3,746 | 2.06 | |
| Green | Ken Adams (write-in) | 70 | 0.04 | |
| Total votes | 181,838 | 100.0 | ||
| Voter turnout | % | |||
| Democratic hold | ||||
2000
| Party | Candidate | Votes | % | |
|---|---|---|---|---|
| Democratic | Robert Matsui (incumbent) | 147,025 | 68.7 | |
| Republican | Ken Payne | 55,945 | 26.2 | |
| Green | Ken Adams | 6,195 | 2.9 | |
| Libertarian | Cullene Lang | 3,746 | 1.3 | |
| Natural Law | Alan Barreca | 2,894 | 1.0 | |
| Total votes | 215,805 | 100.0 | ||
| Voter turnout | % | |||
| Democratic hold | ||||
2002
| Party | Candidate | Votes | % | |
|---|---|---|---|---|
| Democratic | Robert Matsui (incumbent) | 90,697 | 70.9 | |
| Republican | Richard Frankhuizen | 33,313 | 26.1 | |
| Libertarian | Timothy E. Roloff | 3,923 | 3.0 | |
| Total votes | 189,717 | 100.0 | ||
| Voter turnout | % | |||
| Democratic hold | ||||
2004
| Party | Candidate | Votes | % | |
|---|---|---|---|---|
| Democratic | Robert Matsui (incumbent) | 138,004 | 71.4 | |
| Republican | Mike Dugas | 45,120 | 23.4 | |
| Green | Pat Driscoll | 6,593 | 3.4 | |
| Peace and Freedom | John C. Reiger | 3,670 | 1.8 | |
| Total votes | 193,387 | 100.0 | ||
| Voter turnout | % | |||
| Democratic hold | ||||
2005 (special)
Incumbent Robert Matsui died January 1, 2005. In a special election held on March 8, 2005 to fill the vacancy, Matsui's widow, Doris, won the seat with almost 68% of the vote. She was sworn in on March 10, 2005.
| Party | Candidate | Votes | % | |
|---|---|---|---|---|
| Democratic | Doris Matsui | 56,175 | 67.65 | |
| Democratic | Julie Padilla | 7,158 | 8.62 | |
| Republican | John Flynn | 6,559 | 7.90 | |
| Republican | Serge Chernay | 3,742 | 4.51 | |
| Republican | Michael O'Brien | 2,591 | 3.12 | |
| Republican | Shane Singh | 1,753 | 2.11 | |
| Republican | Bruce Stevens | 1,124 | 1.35 | |
| Green | Pat Driscoll | 976 | 1.18 | |
| Independent | Leonard Padilla | 916 | 1.10 | |
| Democratic | Charles Pineda | 659 | 0.79 | |
| Libertarian | Gale Morgan | 451 | 0.54 | |
| Peace and Freedom | John Reiger | 286 | 0.34 | |
| Democratic | Lara Shapiro (write-in) | 6 | 0.01 | |
| Invalid or blank votes | 637 | 0.77 | ||
| Total votes | 83,033 | 100.0 | ||
| Voter turnout | 27.72% | |||
| Democratic hold | ||||
2006
| Party | Candidate | Votes | % | |
|---|---|---|---|---|
| Democratic | Doris Matsui (incumbent) | 89,119 | 70.7 | |
| Republican | Xiaochin Claire Yan | 29,824 | 23.7 | |
| Green | Jeff Kravitz | 5,394 | 4.3 | |
| Peace and Freedom | John C. Reiger | 1,716 | 1.3 | |
| Total votes | 126,053 | 100.0 | ||
| Voter turnout | % | |||
| Democratic hold | ||||
2008
| Party | Candidate | Votes | % | |
|---|---|---|---|---|
| Democratic | Doris Matsui (incumbent) | 164,242 | 74.3 | |
| Republican | Paul A. Smith | 46,002 | 20.9 | |
| Peace and Freedom | L. R. Roberts | 10,731 | 4.8 | |
| Independent | David B.Lynch (write-in candidate) | 180 | 0.0 | |
| Total votes | 221,155 | 100 | ||
| Voter turnout | % | |||
| Democratic hold | ||||
2010
| Party | Candidate | Votes | % | |
|---|---|---|---|---|
| Democratic | Doris Matsui (incumbent) | 124,220 | 72% | |
| Republican | Paul A. Smith | 43,577 | 25% | |
| Peace and Freedom | Gerald Allen Frink | 4,594 | 3% | |
| Total votes | 172,391 | 100% | ||
| Voter turnout | % | |||
| Democratic hold | ||||
2012
| Party | Candidate | Votes | % | |
|---|---|---|---|---|
| Democratic | Mike Thompson | 202,872 | 75% | |
| Republican | Randy Loftin | 69,545 | 25% | |
| Total votes | 272,417 | 100% | ||
| Voter turnout | % | |||
| Democratic hold | ||||
2014
| Party | Candidate | Votes | % | |
|---|---|---|---|---|
| Democratic | Mike Thompson | 129,613 | 76% | |
| Independent | James Hinton | 41,535 | 24% | |
| Total votes | 171,148 | 100% | ||
| Voter turnout | % | |||
| Democratic hold | ||||
Living former Members
As of April 2015, there are two former members of the U.S. House of Representatives from California's 5th congressional district that are currently living.
| Representative | Term in office | Date of birth (and age) |
|---|---|---|
| Nancy Pelosi | 1987 - 1993 | March 26, 1940 |
| Doris Matsui | 2005 - 2013 | March 10, 1944 |
See also
References
- ↑ "California election results - 2012 election". Los Angeles Times. Retrieved February 24, 2013.
- ↑ "Maps: Final Congressional Districts". Citizens Redistricting Commission. Retrieved February 24, 2013.
- ↑ Statement of Vote (2000 President)
- ↑ Statement of Vote (2000 Senator)
- ↑ Statement of Vote (2002 Governor)
- ↑ Statement of Vote (2003 Recall Question)
- ↑ Statement of Vote (2003 Governor)
- ↑ Statement of Vote (2004 President)
- ↑ Statement of Vote (2004 Senator)
- ↑ Statement of Vote (2006 Senator)
- ↑ California Secretary of State. Supplement to the Statement of Vote. President. Counties by Congressional District.
- ↑ Statement of Vote (2010 Governor
- ↑ Statement of Vote (2010 Governor)
- ↑ 1920 election results
- ↑ 1922 election results
- ↑ 1923 special election results
- ↑ 1924 election results
- ↑ 1926 special election results
- ↑ 1926 election results
- ↑ 1928 election results
- ↑ 1930 election results
- ↑ 1932 election results
- ↑ 1934 election results
- ↑ 1936 election results
- ↑ 1938 election results
- ↑ 1940 election results
- ↑ 1942 election results
- ↑ 1944 election results
- ↑ 1946 election results
- ↑ 1948 election results
- ↑ 1949 special election results
- ↑ 1950 election results
- ↑ 1952 election results
- ↑ 1954 election results
- ↑ 1956 election results
- ↑ 1958 election results
- ↑ 1960 election results
- ↑ 1962 election results
- ↑ 1964 election results
- ↑ 1966 election results
- ↑ 1968 election results
- ↑ 1970 election results
- ↑ 1972 election results
- ↑ 1974 election results
- ↑ 1976 election results
- ↑ 1978 election results
- ↑ 1980 election results
- ↑ 1982 election results
- ↑ 1983 special election results
- ↑ 1984 election results
- ↑ 1986 election results
- ↑ 1987 special election results
- ↑ 1988 election results
- ↑ 1990 election results
- ↑ 1992 election results
- ↑ 1994 election results
- ↑ 1996 election results
- ↑ 1998 election results
- ↑ 2000 election results
- ↑ 2002 election results Archived February 3, 2009, at the Wayback Machine.
- ↑ 2004 election results
- ↑ "Special Election Results" (PDF). Secretary of State of California. Retrieved 2008-05-29.
- ↑ 2006 election results Archived November 27, 2008, at the Wayback Machine.
- ↑ Office of the California Secretary of State Archived December 21, 2008, at the Wayback Machine. "United States Representative in Congress, (retrieved on August 9th, 2009).
- ↑ Office of the California Secretary of State "United States Representative in Congress, (retrieved on March 24th, 2011).
- ↑ Office of the California Secretary of State "United States Representative in Congress, (retrieved on March 24th, 2011).
- ↑ Office of the California Secretary of State "United States Representative in Congress, (retrieved on March 24th, 2011).
External links
- GovTrack.us: California's 5th congressional district
- RAND California Election Returns: District Definitions (out of date)
- California Voter Foundation map - CD05 (out of date)
- Interview of Paul Smith, Republican candidate for the 5th CD recorded July 15, 2008 in Sacramento, CA
Coordinates: 38°30′N 122°30′W / 38.5°N 122.5°W