California's 2nd congressional district
| California's 2nd congressional district | ||
|---|---|---|
.tif.png) | ||
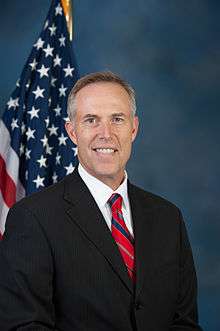
| Current Representative | Jared Huffman (D–San Rafael) | |
| Population (2015) | 720,346[1] | |
| Median income | $65,414 | |
| Ethnicity | 79.6% White, 1.6% Black, 4.1% Asian, 17.7% Hispanic, 2.2% Native American, 7.3% other | |
| Cook PVI | D+20 | |
California's 2nd congressional district is a congressional district in the U.S. state of California.
Jared Huffman, a Democrat, has represented the district since January 2013.
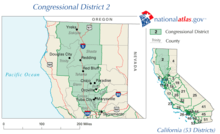
Currently, the 2nd district encompasses the northern coast of the state. It stretches from the Golden Gate Bridge to the Oregon border and includes all of Highway 101 north of San Francisco except for a stretch in Sonoma County. It consists of Marin, Mendocino, Humboldt, Del Norte, and Trinity counties plus portions of Sonoma County. Cities in the district include San Rafael, Petaluma, Novato, Windsor, Healdsburg, Ukiah, Fort Bragg, Fortuna, Eureka, Arcata, McKinleyville, and Crescent City, California.[2]
Prior to redistricting by the California Citizens Redistricting Commission of 2011, the 2nd district encompassed much of the far northern part of the state, from Sacramento to the Oregon border. It was the largest district by area in California. It consisted of Colusa, Glenn, Sutter, Tehama, Trinity, and Yuba counties plus portions of Butte and Yolo counties. Much of this territory is now the 1st District, while the 6th District covered most of the territory now in the 2nd District.
Competitiveness
Prior to 2013, the 2nd District had a dramatically different political history than its current incarnation. It had been a Republican stronghold for the better part of three decades.
George W. Bush won the district in 2004 with 62% of the vote. John McCain carried the district in 2008 with 56.1% of the vote. Barack Obama won the district in 2012 with 68.7% of the vote.
Election results from statewide races
| Year | Office | Results |
|---|---|---|
| 1990 | Governor | Wilson 56.9 - 37.4% |
| 1992 | President | Bush 38.7 - 35.7% |
| Senator | Herschensohn 52.7 - 35.6% | |
| Senator (special) | Seymour 47.0 - 42.7% | |
| 1994 | Governor | Wilson 64.2 - 29.7% |
| Senator | Huffington 57.8 - 32.8% | |
| 1996 | President | Dole 50.9 - 36.1% |
| 1998 | Governor | [Data unknown/missing. You can help!] |
| Senator | [Data unknown/missing. You can help!] | |
| 2000 | President | Bush 59.2 - 34.1% |
| Senator | Campbell 50.9 - 39.5% | |
| 2002 | Governor | Simon 57.6 - 31.1% |
| 2003 | Recall | Yes 70.5 - 29.5% |
| Schwarzenegger 57.6 - 18.5% | ||
| 2004 | President | Bush 62.0 - 36.6% |
| Senator | Jones 55.5 - 39.6% | |
| 2006 | Governor | Schwarzenegger 70.5 - 23.7% |
| Senator | Mountjoy 51.8 - 42.0% | |
| 2008 | President | McCain 55.0 - 42.6% |
| 2010 | Governor | Whitman 55.2 - 37.6% |
| Senator | Fiorina 60.2 - 31.9% | |
| 2012 | President | Obama 68.7 - 26.8% |
| Senator | Feinstein 72.6 - 27.4% |
List of representatives
.jpg)
.jpg)
.jpg)
.jpg)
.jpg)
Election results for representatives
|
1864 • 1866 • 1868 • 1870 • 1872 • 1874 • 1876 • 1878 • 1880 • 1882 • 1884 • 1886 • 1888 • 1890 • 1892 • 1894 • 1896 • 1898 • 1900 (Special) • 1902 • 1904 • 1906 • 1908 • 1910 • 1912 • 1914 • 1916 • 1918 • 1920 • 1922 • 1924 • 1926 (Special) • 1926 • 1928 • 1930 • 1932 • 1934 • 1936 • 1938 • 1940 • 1942 • 1943 (Special) • 1944 • 1946 • 1948 • 1950 • 1952 • 1954 • 1956 • 1958 • 1960 • 1962 • 1964 • 1966 • 1968 • 1970 • 1972 • 1974 • 1976 • 1978 • 1980 • 1982 • 1984 • 1986 • 1988 • 1990 • 1992 • 1994 • 1996 • 1998 • 2000 • 2002 • 2004 • 2006 • 2008 • 2010 • 2012 • 2014 • 2016 |
1864
| Party | Candidate | Votes | % | |
|---|---|---|---|---|
| Republican | William Higby | 23,414 | 61.6 | |
| Democratic | James W. Coffroth | 14,581 | 38.4 | |
| Total votes | 37,995 | 100.0 | ||
| Voter turnout | % | |||
| Republican hold | ||||
1866
| Party | Candidate | Votes | % | ± | |
|---|---|---|---|---|---|
| Republican | William Higby (incumbent) | 16,053 | 52.0 | -9.6% | |
| Democratic | James W. Coffroth | 14,786 | 48.0 | +9.6% | |
| Total votes | 30,839 | 100.0 | |||
| Voter turnout | % | ||||
| Republican hold | |||||
1868
| Party | Candidate | Votes | % | ± | |
|---|---|---|---|---|---|
| Republican | Aaron Augustus Sargent | 18,264 | 54.7 | +2.7 | |
| Democratic | James W. Coffroth | 15,124 | 45.3 | -2.7% | |
| Total votes | 33,388 | 100.0 | |||
| Voter turnout | % | ||||
| Republican hold | |||||
1870
| Party | Candidate | Votes | % | ± | |
|---|---|---|---|---|---|
| Republican | Aaron Augustus Sargent (inc.) | 18,065 | 54.0 | -0.7% | |
| Democratic | James W. Coffroth | 15,382 | 46.0 | +0.7% | |
| Total votes | 33,447 | 100.0 | |||
| Voter turnout | % | ||||
| Republican hold | |||||
1872
| Party | Candidate | Votes | % | ± | |
|---|---|---|---|---|---|
| Republican | Horace F. Page | 13,803 | 51.9 | -2.1% | |
| Democratic | Pasz Coggins | 12,816 | 48.1 | +2.1% | |
| Total votes | 26,619 | 100.0 | |||
| Voter turnout | % | ||||
| Republican hold | |||||
1874
| Party | Candidate | Votes | % | ± | |
|---|---|---|---|---|---|
| Republican | Horace F. Page (incumbent) | 13,624 | 43.4 | -8.5% | |
| Democratic | Hy Larkin | 12,154 | 38.8 | -9.3% | |
| Independent | Charles R. Tuttle | 5,589 | 17.8 | ||
| Total votes | 31,367 | 100.0 | |||
| Voter turnout | % | ||||
| Republican hold | |||||
1876
| Party | Candidate | Votes | % | ± | |
|---|---|---|---|---|---|
| Republican | Horace F. Page (incumbent) | 20,815 | 56.7 | +13.3% | |
| Democratic | G. J. Carpenter | 15,916 | 43.3 | +4.5% | |
| Total votes | 36,731 | 100.0 | |||
| Voter turnout | % | ||||
| Republican hold | |||||
1878
| Party | Candidate | Votes | % | ± | |
|---|---|---|---|---|---|
| Republican | Horace F. Page (incumbent) | 19,386 | 51.9 | -4.8% | |
| Democratic | Thomas J. Clunie | 12,847 | 34.4 | -8.9% | |
| Workingman's | H. B. Williams [3] | 5,139 | 13.8 | ||
| Total votes | 37,372 | 100.0 | |||
| Voter turnout | % | ||||
| Republican hold | |||||
1880
| Party | Candidate | Votes | % | ± | |
|---|---|---|---|---|---|
| Republican | Horace F. Page (incumbent) | 22,038 | 53.6 | +1.7% | |
| Democratic | John R. Glasscock | 18,859 | 45.9 | +11.5% | |
| Greenback | Benjamin Todd [4] | 296 | 0.4 | ||
| Prohibition | B. K. Lowe | 41 | 0.1 | ||
| Total votes | 41,118 | 100.0 | |||
| Voter turnout | % | ||||
| Republican hold | |||||
1882
| Party | Candidate | Votes | % | ± | ||
|---|---|---|---|---|---|---|
| Democratic | James Budd | 20,229 | 50.5 | +4.6% | ||
| Republican | Horace F. Page (incumbent) | 19,246 | 48.1 | -5.5% | ||
| Prohibition | J. L. Coles | 478 | 1.2 | +1.1% | ||
| Greenback | F. J. Woodward [5] | 78 | 0.2 | -0.2% | ||
| Total votes | 40,031 | 100.0 | ||||
| Voter turnout | % | |||||
| Democratic gain from Republican | ||||||
1884
| Party | Candidate | Votes | % | ± | ||
|---|---|---|---|---|---|---|
| Republican | James A. Louttit | 18,327 | 49.4 | +1.3% | ||
| Democratic | Charles Allen Sumner | 18,208 | 49.1 | -1.4% | ||
| Prohibition | Joshua B. Webster | 558 | 1.5 | +0.3% | ||
| Total votes | 37,093 | 100.0 | ||||
| Voter turnout | % | |||||
| Republican gain from Democratic | ||||||
1886
| Party | Candidate | Votes | % | ± | ||
|---|---|---|---|---|---|---|
| Democratic | Marion Biggs | 17,667 | 50.0 | +0.9% | ||
| Republican | J. C. Campbell | 16,594 | 47.0 | -2.4% | ||
| Prohibition | W. O. Clark | 1,076 | 3.0 | +1.5% | ||
| Total votes | 35,337 | 100.0 | ||||
| Voter turnout | % | |||||
| Democratic gain from Republican | ||||||
1888
| Party | Candidate | Votes | % | ± | |
|---|---|---|---|---|---|
| Democratic | Marion Biggs (incumbent) | 19,064 | 50.6 | +0.6% | |
| Republican | John A. Eagon | 17,541 | 46.6 | -0.4% | |
| Independent | S. M. McLean | 913 | 2.4 | ||
| Know Nothing | J. F. McSwain [6] | 138 | 0.4 | ||
| Total votes | 37,656 | 100.0 | |||
| Voter turnout | % | ||||
| Democratic hold | |||||
1890
| Party | Candidate | Votes | % | ± | |
|---|---|---|---|---|---|
| Democratic | Anthony Caminetti | 18,644 | 49.0 | -1.6% | |
| Republican | George G. Blanchard | 18,485 | 48.6 | +2.0% | |
| Prohibition | J. S. Witherell | 912 | 2.4 | ||
| Total votes | 38,041 | 100.0 | |||
| Voter turnout | % | ||||
| Democratic hold | |||||
1892
| Party | Candidate | Votes | % | ± | |
|---|---|---|---|---|---|
| Democratic | Anthony Caminetti (inc.) | 20,741 | 53.3 | +4.3% | |
| Republican | John F. Davis | 16,781 | 43.1 | -5.5% | |
| Prohibition | Chauncey H. Dunn | 1,307 | 3.4 | +1.0% | |
| Independent | J. H. White | 122 | 0.3 | ||
| Total votes | 38,951 | 100.0 | |||
| Voter turnout | % | ||||
| Democratic hold | |||||
1894
| Party | Candidate | Votes | % | ± | ||
|---|---|---|---|---|---|---|
| Republican | Grove L. Johnson | 19,302 | 43.0 | -0.1% | ||
| Democratic | Anthony Caminetti (incumbent) | 15,732 | 35.1 | -18.2% | ||
| Populist | Burdell Cornell | 8,946 | 20.0 | |||
| Prohibition | Elam Briggs | 866 | 1.9 | -1.5% | ||
| Total votes | 44,846 | 100.0 | ||||
| Voter turnout | % | |||||
| Republican gain from Democratic | ||||||
1896
| Party | Candidate | Votes | % | ± | ||
|---|---|---|---|---|---|---|
| Democratic | Marion De Vries | 24,434 | 55.5 | +20.4% | ||
| Republican | Grove L. Johnson (inc.) | 18,613 | 42.3 | -0.7% | ||
| Prohibition | F. E. Coulter | 974 | 2.2 | +0.3% | ||
| Total votes | 44,021 | 100.0 | ||||
| Voter turnout | % | |||||
| Democratic gain from Republican | ||||||
1898
| Party | Candidate | Votes | % | ± | |
|---|---|---|---|---|---|
| Democratic | Marion De Vries (incumbent) | 25,196 | 55.3 | -0.2% | |
| Republican | Frank D. Ryan | 20,400 | 44.7 | +2.4% | |
| Total votes | 45,596 | 100.0 | |||
| Voter turnout | % | ||||
| Democratic hold | |||||
1900 (Special)
| Party | Candidate | Votes | % | ± | ||
|---|---|---|---|---|---|---|
| Republican | Samuel D. Woods | 23,019 | 50.4 | +5.7% | ||
| Democratic | J. D. Sproul | 21,851 | 47.9 | -7.4% | ||
| Social Democrat | W. F. Lockwood [7] | 402 | 0.9 | |||
| Prohibition | W. H. Barron | 371 | 0.8 | |||
| Total votes | 45,643 | 100.0 | ||||
| Voter turnout | % | |||||
| Republican gain from Democratic | ||||||
1902
| Party | Candidate | Votes | % | ± | ||
|---|---|---|---|---|---|---|
| Democratic | Theodore A. Bell | 21,536 | 49.2 | +1.3% | ||
| Republican | Frank Coombs (incumbent) | 21,181 | 48.3 | -2.1% | ||
| Socialist | G. H. Rogers | 731 | 1.7 | |||
| Prohibition | W. P. Fassett | 367 | 0.8 | |||
| Total votes | 43,815 | 100.0 | ||||
| Voter turnout | % | |||||
| Democratic gain from Republican | ||||||
1904
| Party | Candidate | Votes | % | ± | ||
|---|---|---|---|---|---|---|
| Republican | Duncan E. McKinlay (inc.) | 22,873 | 49.2 | +0.9% | ||
| Democratic | Theodore A. Bell | 21,640 | 46.6 | -1.7% | ||
| Socialist | J. H. White | 1,524 | 3.3 | +1.6% | ||
| Prohibition | Eli P. LaCell | 431 | 0.9 | +0.1% | ||
| Total votes | 46,468 | 100.0 | ||||
| Voter turnout | % | |||||
| Republican gain from Democratic | ||||||
1906
| Party | Candidate | Votes | % | ± | |
|---|---|---|---|---|---|
| Republican | Duncan E. McKinlay (inc.) | 23,411 | 51.8 | +2.6% | |
| Democratic | W. A. Beard | 20,262 | 44.8 | -1.8% | |
| Socialist | A. J. Gaylord | 1,524 | 3.4 | +0.1% | |
| Total votes | 45,197 | 100.0 | |||
| Voter turnout | % | ||||
| Republican hold | |||||
1908
| Party | Candidate | Votes | % | ± | |
|---|---|---|---|---|---|
| Republican | Duncan E. McKinlay (inc.) | 28,627 | 57.5 | +5.7% | |
| Democratic | W. K. Hays | 19,193 | 38.5 | -6.3% | |
| Socialist | A. J. Gaylord | 2,003 | 4.0 | +0.6% | |
| Total votes | 49,823 | 100.0 | |||
| Voter turnout | % | ||||
| Republican hold | |||||
1910
| Party | Candidate | Votes | % | ± | |
|---|---|---|---|---|---|
| Republican | William Kent | 25,346 | 50.1 | +11.6% | |
| Democratic | I. G. Zumwalt | 22,229 | 44.0 | -13.5% | |
| Socialist | W. H. Ferber | 2,647 | 5.2 | +1.2% | |
| Prohibition | Henry P. Stipp | 329 | 0.7 | ||
| Total votes | 50,451 | 100.0 | |||
| Voter turnout | % | ||||
| Republican hold | |||||
1912
| Party | Candidate | Votes | % | ± | |
|---|---|---|---|---|---|
| Democratic | John E. Raker (incumbent) | 23,467 | 62.6 | +12.5% | |
| Republican | Frank M. Rutherford | 10,178 | 27.2 | -16.8% | |
| Socialist | J. C. Williams | 3,818 | 10.2 | +5.0% | |
| Total votes | 37,463 | 100.0 | |||
| Voter turnout | % | ||||
| Democratic hold | |||||
1914
| Party | Candidate | Votes | % | ± | |
|---|---|---|---|---|---|
| Democratic | John E. Raker (incumbent) | 32,575 | 64.7 | +2.1% | |
| Republican | James T. Matlock | 15,716 | 31.2 | +4.0% | |
| Prohibition | W. P. Fassett | 2,086 | 4.1 | ||
| Total votes | 50,377 | 100.0 | |||
| Voter turnout | % | ||||
| Democratic hold | |||||
1916
| Party | Candidate | Votes | % | ± | |
|---|---|---|---|---|---|
| Democratic | John E. Raker (incumbent) | 30,042 | 71 | +6.3% | |
| Republican | Edward H. Hart | 12,282 | 29 | -2.2% | |
| Total votes | 42,324 | 100 | |||
| Voter turnout | % | ||||
| Democratic hold | |||||
1918
| Party | Candidate | Votes | % | ± | |
|---|---|---|---|---|---|
| Democratic | John E. Raker (incumbent) | 28,249 | 100.0 | +29% | |
| Voter turnout | % | ||||
| Democratic hold | |||||
1920
| Party | Candidate | Votes | % | |
|---|---|---|---|---|
| Democratic | John E. Raker (incumbent) | 26,172 | 100.0 | |
| Voter turnout | % | |||
| Democratic hold | ||||
1922
| Party | Candidate | Votes | % | |
|---|---|---|---|---|
| Democratic | John E. Raker (incumbent) | 32,981 | 100.0 | |
| Voter turnout | % | |||
| Democratic hold | ||||
1924
| Party | Candidate | Votes | % | |
|---|---|---|---|---|
| Democratic | John E. Raker (incumbent) | 30,590 | 100.0 | |
| Voter turnout | % | |||
| Democratic hold | ||||
1926 (Special)
Republican Harry Lane Englebright won the special election to replace Democrat John E. Raker, who died in office. Data for this special election is not available.[11]
1926
| Party | Candidate | Votes | % | |||
|---|---|---|---|---|---|---|
| Republican | Harry Lane Englebright (inc.) | 32,264 | 100.0 | |||
| Voter turnout | % | |||||
| Republican gain from Democratic | ||||||
1928
| Party | Candidate | Votes | % | |
|---|---|---|---|---|
| Republican | Harry Lane Englebright (inc.) | 32,455 | 100.0 | |
| Voter turnout | % | |||
| Republican hold | ||||
1930
| Party | Candidate | Votes | % | |
|---|---|---|---|---|
| Republican | Harry Lane Englebright (inc.) | 35,941 | 100.0 | |
| Voter turnout | % | |||
| Republican hold | ||||
1932
| Party | Candidate | Votes | % | |
|---|---|---|---|---|
| Republican | Harry Lane Englebright (inc.) | 43,146 | 100.0 | |
| Voter turnout | % | |||
| Republican hold | ||||
1934
| Party | Candidate | Votes | % | |
|---|---|---|---|---|
| Republican | Harry Lane Englebright (inc.) | 66,370 | 100.0 | |
| Voter turnout | % | |||
| Republican hold | ||||
1936
| Party | Candidate | Votes | % | |
|---|---|---|---|---|
| Republican | Harry Lane Englebright (inc.) | 51,416 | 100.0 | |
| Voter turnout | % | |||
| Republican hold | ||||
1938
| Party | Candidate | Votes | % | |
|---|---|---|---|---|
| Republican | Harry Lane Englebright (inc.) | 71,496 | 100.0 | |
| Voter turnout | % | |||
| Republican hold | ||||
1940
| Party | Candidate | Votes | % | |
|---|---|---|---|---|
| Republican | Harry Lane Englebright (inc.) | 71,033 | 100.0 | |
| Voter turnout | % | |||
| Republican hold | ||||
1942
| Party | Candidate | Votes | % | |
|---|---|---|---|---|
| Republican | Harry Lane Englebright (inc.) | 50,094 | 100.0 | |
| Voter turnout | % | |||
| Republican hold | ||||
1943 (Special)
Democrat Clair Engle won the special election to replace Republican Harry Lane Englebright, who died in office. Data for this special election is not available.[21]
1944
| Party | Candidate | Votes | % | ± | |
|---|---|---|---|---|---|
| Democratic | Clair Engle (incumbent) | 48,201 | 63.8 | +63.8% | |
| Republican | Jesse M. Mayo | 27,312 | 36.2 | -63.8% | |
| Total votes | 75,513 | 100.0 | |||
| Voter turnout | % | ||||
| Democratic hold | |||||
1946
| Party | Candidate | Votes | % | ± | |
|---|---|---|---|---|---|
| Democratic | Clair Engle (incumbent) | 57,895 | 100.0 | +36.2% | |
| Voter turnout | % | ||||
| Democratic hold | |||||
1948
| Party | Candidate | Votes | % | |
|---|---|---|---|---|
| Democratic | Clair Engle (incumbent) | 78,555 | 100.0 | |
| Voter turnout | % | |||
| Democratic hold | ||||
1950
| Party | Candidate | Votes | % | |
|---|---|---|---|---|
| Democratic | Clair Engle (incumbent) | 85,103 | 100.0 | |
| Voter turnout | % | |||
| Democratic hold | ||||
1952
| Party | Candidate | Votes | % | |
|---|---|---|---|---|
| Democratic | Clair Engle (incumbent) | 124,179 | 100.0 | |
| Voter turnout | % | |||
| Democratic hold | ||||
1954
| Party | Candidate | Votes | % | |
|---|---|---|---|---|
| Democratic | Clair Engle (incumbent) | 113,104 | 100.0 | |
| Voter turnout | % | |||
| Democratic hold | ||||
1956
| Party | Candidate | Votes | % | |
|---|---|---|---|---|
| Democratic | Clair Engle (incumbent) | 136,544 | 100.0 | |
| Voter turnout | % | |||
| Democratic hold | ||||
1958
| Party | Candidate | Votes | % | ± | |
|---|---|---|---|---|---|
| Democratic | Harold T. Johnson | 90,850 | 61 | -39% | |
| Republican | Curtis W. Tarr | 58,199 | 39 | +39% | |
| Total votes | 149,049 | 100 | |||
| Voter turnout | % | ||||
| Democratic hold | |||||
1960
| Party | Candidate | Votes | % | ± | |
|---|---|---|---|---|---|
| Democratic | Harold T. Johnson (inc.) | 109,565 | 62.7 | +1.7% | |
| Republican | Curtis W. Tarr | 65,198 | 37.3 | -1.7% | |
| Total votes | 174,763 | 100.0 | |||
| Voter turnout | % | ||||
| Democratic hold | |||||
1962
| Party | Candidate | Votes | % | ± | |
|---|---|---|---|---|---|
| Democratic | Harold T. Johnson (inc.) | 106,239 | 64.6 | +1.9% | |
| Republican | Frederic H. Nagel | 58,150 | 35.4 | -1.9% | |
| Total votes | 164,389 | 100.0 | |||
| Voter turnout | % | ||||
| Democratic hold | |||||
1964
| Party | Candidate | Votes | % | |
|---|---|---|---|---|
| Democratic | Harold T. Johnson (inc.) | 125,774 | 64.6 | |
| Republican | Chester C. Merriam | 68,835 | 35.4 | |
| Total votes | 194,609 | 100.0 | ||
| Voter turnout | % | |||
| Democratic hold | ||||
1966
| Party | Candidate | Votes | % | ± | |
|---|---|---|---|---|---|
| Democratic | Harold T. Johnson (inc.) | 131,145 | 70.9 | +6.3% | |
| Republican | William H. Romack, Jr. | 53,753 | 29.1 | -6.3% | |
| Total votes | 184,898 | 100.0 | |||
| Voter turnout | % | ||||
| Democratic hold | |||||
1968
| Party | Candidate | Votes | % | ± | |
|---|---|---|---|---|---|
| Democratic | Harold T. Johnson (inc.) | 127,880 | 60.8 | -10.1% | |
| Republican | Osmer E. Dunaway | 78,986 | 37.5 | +8.4% | |
| American Independent | Paul J. Huft | 3,577 | 1.7 | ||
| Total votes | 210,443 | 100.0 | |||
| Voter turnout | % | ||||
| Democratic hold | |||||
1970
| Party | Candidate | Votes | % | ± | |
|---|---|---|---|---|---|
| Democratic | Harold T. Johnson (inc.) | 151,070 | 77.9 | +17.1% | |
| Republican | Lloyd E. Gilbert | 37,223 | 19.2 | -18.3% | |
| American Independent | Jack R. Carrigg | 5,681 | 2.9 | +1.2% | |
| Total votes | 193,974 | 100.0 | |||
| Voter turnout | % | ||||
| Democratic hold | |||||
1972
| Party | Candidate | Votes | % | ± | |
|---|---|---|---|---|---|
| Democratic | Harold T. Johnson (inc.) | 148,808 | 68.3 | -9.6% | |
| Republican | Francis X. Callahan | 62,381 | 28.6 | +9.4% | |
| American Independent | Dorothy D. Paradis | 6,688 | 3.1 | +0.2% | |
| Total votes | 217,877 | 100.0 | |||
| Voter turnout | % | ||||
| Democratic hold | |||||
1974
| Party | Candidate | Votes | % | ± | |
|---|---|---|---|---|---|
| Republican | Donald H. Clausen (inc.) | 95,508 | 53 | +24.4% | |
| Democratic | Oscar H. Klee | 76,951 | 42.7 | -25.6% | |
| Peace and Freedom | Carole J. Glass | 7,719 | 4.3 | ||
| Total votes | 180,178 | 100.0 | |||
| Voter turnout | % | ||||
| Republican hold | |||||
1976
| Party | Candidate | Votes | % | ± | |
|---|---|---|---|---|---|
| Republican | Donald H. Clausen (inc.) | 121,290 | 56 | +3% | |
| Democratic | Oscar H. Klee | 88,829 | 41 | -1.7% | |
| Peace and Freedom | Robert B. "Bob" Allred | 6,444 | 3 | -1.3% | |
| Total votes | 216,563 | 100 | |||
| Voter turnout | % | ||||
| Republican hold | |||||
1978
| Party | Candidate | Votes | % | ± | |
|---|---|---|---|---|---|
| Republican | Donald H. Clausen (inc.) | 114,451 | 52.0 | -4% | |
| Democratic | Norma Bork | 99,712 | 45.3 | +4.3% | |
| Peace and Freedom | Irv Sutley | 6,097 | 2.8 | -0.2% | |
| Total votes | 220,260 | 100.0 | |||
| Voter turnout | % | ||||
| Republican hold | |||||
1980
| Party | Candidate | Votes | % | ± | |
|---|---|---|---|---|---|
| Republican | Donald H. Clausen (inc.) | 141,698 | 54.2 | +3.7% | |
| Democratic | Norma K. Bork | 109,789 | 42.0 | -3.3% | |
| Libertarian | Daniel Mosier | 6,833 | 2.6 | ||
| Peace and Freedom | Linda D. Wren | 3,354 | 1.3 | -1.5% | |
| Total votes | 261,674 | 100.0 | |||
| Voter turnout | % | ||||
| Republican hold | |||||
1982
| Party | Candidate | Votes | % | ± | |
|---|---|---|---|---|---|
| Republican | Eugene A. Chappie (inc.) | 116,172 | 57.9 | +3.7% | |
| Democratic | John Newmeyer | 81,314 | 40.5 | -1.5% | |
| Peace and Freedom | Howard Fegarsky | 3,126 | 1.6 | +0.3% | |
| Total votes | 200,612 | 100.0 | |||
| Voter turnout | % | ||||
| Republican hold | |||||
1984
| Party | Candidate | Votes | % | ± | |
|---|---|---|---|---|---|
| Republican | Eugene A. Chappie (inc.) | 158,679 | 69.5 | +11.6% | |
| Democratic | Harry Cozad | 69,793 | 30.5 | -10% | |
| Total votes | 228,472 | 100.0 | |||
| Voter turnout | % | ||||
| Republican hold | |||||
1986
| Party | Candidate | Votes | % | ± | |
|---|---|---|---|---|---|
| Republican | Wally Herger | 109,758 | 58.3 | -11.2% | |
| Democratic | Stephen C. Swendiman | 74,602 | 39.6 | +9.1% | |
| Libertarian | Harry Hugh "Doc" Pendery | 4,054 | 2.2 | ||
| Total votes | 188,414 | 100.0 | |||
| Voter turnout | % | ||||
| Republican hold | |||||
1988
| Party | Candidate | Votes | % | ± | |
|---|---|---|---|---|---|
| Republican | Wally Herger (incumbent) | 139,010 | 58.8 | +0.5% | |
| Democratic | Wayne R. Meyer | 91,088 | 38.5 | -1.1% | |
| Libertarian | Harry Hugh "Doc" Pendery | 6,253 | 2.6 | 0.4% | |
| Total votes | 236,351 | 100.0 | |||
| Voter turnout | % | ||||
| Republican hold | |||||
1990
| Party | Candidate | Votes | % | ± | |
|---|---|---|---|---|---|
| Republican | Wally Herger (incumbent) | 133,315 | 63.7 | +4.9% | |
| Democratic | Erwin E. "Bill" Rush | 65,333 | 31.2 | -7.3% | |
| Libertarian | Ross Crain | 10,753 | 5.1 | +2.5% | |
| Total votes | 209,401 | 100.0 | |||
| Voter turnout | % | ||||
| Republican hold | |||||
1992
| Party | Candidate | Votes | % | ± | |
|---|---|---|---|---|---|
| Republican | Wally Herger (incumbent) | 167,247 | 65.2 | +1.5% | |
| Democratic | Elliot Roy Freedman | 71,780 | 28.0 | -3.2% | |
| Libertarian | Harry H. "Doc" Pendery | 17,529 | 6.8 | +1.7% | |
| Total votes | 256,556 | 100.0 | |||
| Voter turnout | % | ||||
| Republican hold | |||||
1994
| Party | Candidate | Votes | % | ± | |
|---|---|---|---|---|---|
| Republican | Wally Herger (incumbent) | 137,864 | 64.2 | -1% | |
| Democratic | Mary Jacobs | 55,959 | 26 | -2% | |
| American Independent | Devvy Kidd | 15,619 | 7.3 | ||
| Libertarian | Harry H. "Doc" Pendery | 5,418 | 2.5 | -4.3% | |
| Total votes | 214,860 | 100.0 | |||
| Voter turnout | % | ||||
| Republican hold | |||||
1996
| Party | Candidate | Votes | % | ± | |
|---|---|---|---|---|---|
| Republican | Wally Herger (incumbent) | 144,913 | 60.9 | -3.3% | |
| Democratic | Roberts Braden | 80,401 | 33.7 | +7.7% | |
| Natural Law | Patrice Thiessen | 7,253 | 3.0 | ||
| Libertarian | William Brunner | 5,759 | 2.4 | -0.1% | |
| Republican | Bob Todd (write-in) | 7 | 0.0 | ||
| Total votes | 238,333 | 100.0 | |||
| Voter turnout | % | ||||
| Republican hold | |||||
1998
| Party | Candidate | Votes | % | ± | |
|---|---|---|---|---|---|
| Republican | Wally Herger (incumbent) | 128,372 | 62.5 | +1.6% | |
| Democratic | Roberts "Rob" Braden | 70,837 | 34.5 | +0.8% | |
| Natural Law | Patrice Thiessen | 6,138 | 3 | ||
| Democratic | Stephen F. Scott (write-in) | 20 | 0.01 | ||
| Total votes | 205,367 | 100.0 | |||
| Voter turnout | % | ||||
| Republican hold | |||||
2000
| Party | Candidate | Votes | % | ± | |
|---|---|---|---|---|---|
| Republican | Wally Herger (incumbent) | 168,172 | 65.8 | +3.3% | |
| Democratic | Stan Morgan | 72,075 | 28.2 | -6.3% | |
| Natural Law | John McDermott | 8,910 | 3.4 | +0.4% | |
| Libertarian | Charles R. Martin | 6,699 | 2.6 | ||
| Total votes | 255,856 | 100.0 | |||
| Voter turnout | % | ||||
| Republican hold | |||||
2002
| Party | Candidate | Votes | % | ± | |
|---|---|---|---|---|---|
| Republican | Wally Herger (incumbent) | 117,747 | 65.8 | ||
| Democratic | Mike Johnson | 52,455 | 29.4 | +1.2% | |
| Natural Law | Patrice Thiessen | 4,860 | 2.7 | -0.7% | |
| Libertarian | Charles R. Martin | 3,923 | 2.1 | -0.5% | |
| Total votes | 178,985 | 100.0 | |||
| Voter turnout | % | ||||
| Republican hold | |||||
2004
| Party | Candidate | Votes | % | ± | |
|---|---|---|---|---|---|
| Republican | Wally Herger (incumbent) | 182,119 | 66.9 | +1.1% | |
| Democratic | Mike Johnson | 90,310 | 33.1 | +3.7% | |
| Total votes | 272,429 | 100.0 | |||
| Voter turnout | % | ||||
| Republican hold | |||||
2006
| Party | Candidate | Votes | % | ± | |
|---|---|---|---|---|---|
| Republican | Wally Herger (incumbent) | 134,911 | 64.2 | -2.7% | |
| Democratic | Arjinderpal Sekhon | 68,234 | 32.5 | -0.6% | |
| Libertarian | E. Kent Hinesley | 7,057 | 3.3 | ||
| Total votes | 210,202 | 100.0 | |||
| Voter turnout | % | ||||
| Republican hold | |||||
2008
| Party | Candidate | Votes | % | ± | |
|---|---|---|---|---|---|
| Republican | Wally Herger (incumbent) | 163,459 | 57.9 | -6.3% | |
| Democratic | Jeff Morris | 118,878 | 42.1 | +9.6% | |
| Total votes | 228,356 | 100.00 | |||
| Voter turnout | % | ||||
| Republican hold | |||||
2010
| Party | Candidate | Votes | % | ± | |
|---|---|---|---|---|---|
| Republican | Wally Herger (incumbent) | 129,984 | 57% | -0.8% | |
| Democratic | Jim Reed | 97,514 | 43% | +0.8% | |
| Invalid or blank votes | |||||
| Total votes | 227,498 | 100% | |||
| Republican hold | |||||
2012
| Party | Candidate | Votes | % | ± | |
|---|---|---|---|---|---|
| Democratic | Jared Huffman | 159,287 | 70% | +27.2% | |
| Republican | Daniel Roberts | 67,882 | 30% | -27.2% | |
| Total votes | 227,169 | 100% | |||
| Democratic hold | |||||
2014
| Party | Candidate | Votes | % | ± | |
|---|---|---|---|---|---|
| Democratic | Jared Huffman | 163,124 | 75% | +4.9 | |
| Republican | Dale K. Mensing | 54,400 | 25% | -4.9 | |
| Total votes | 217,524 | 100% | |||
| Democratic hold | |||||
2016
| Party | Candidate | Votes | % | ± | |
|---|---|---|---|---|---|
| Democratic | TBD | ||||
| Republican | TBD | ||||
| Total votes | ' | ' | |||
Living former Members
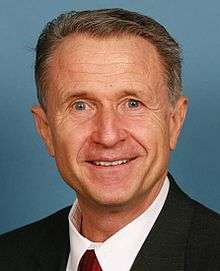
As of April 2015, there is one former member of the U.S. House of Representatives from California's 2nd congressional district that is currently living.
| Representative | Term in office | Date of birth (and age) |
|---|---|---|
| Wally Herger | 1987 - 2013 | May 20, 1945 |
Historical district boundaries
See also
References
- ↑ https://www.census.gov/mycd/
- ↑ "Maps: Final Congressional Districts". Citizens Redistricting Commission. Retrieved February 24, 2013.
- ↑ http://www.joincalifornia.com/candidate/7583
- ↑ http://www.joincalifornia.com/candidate/7081
- ↑ http://www.joincalifornia.com/candidate/12000
- ↑ http://www.joincalifornia.com/candidate/7297
- ↑ http://www.joincalifornia.com/candidate/6610
- ↑ 1920 general election results
- ↑ 1922 general election results
- ↑ 1924 general election results
- ↑ 1926 special election results
- ↑ 1926 general election results
- ↑ 1928 general election results
- ↑ 1930 general election results
- ↑ 1932 general election results
- ↑ 1934 general election results
- ↑ 1936 general election results
- ↑ 1938 general election results
- ↑ 1940 general election results
- ↑ 1942 general election results
- ↑ 1943 special election results
- ↑ 1944 general election results
- ↑ 1946 general election results
- ↑ 1948 general election results
- ↑ 1950 general election results
- ↑ 1952 general election results
- ↑ 1954 general election results
- ↑ 1956 general election results
- ↑ 1958 general election results
- ↑ 1960 general election results
- ↑ 1962 general election results
- ↑ 1964 general election results
- ↑ 1966 general election results
- ↑ 1968 general election results
- ↑ 1970 general election results
- ↑ 1972 general election results
- ↑ 1974 general election results
- ↑ 1976 general election results
- ↑ 1978 general election results
- ↑ 1980 general election results
- ↑ 1982 general election results
- ↑ 1984 general election results
- ↑ 1986 general election results
- ↑ 1988 general election results
- ↑ 1990 general election results
- ↑ 1992 general election results
- ↑ 1994 general election results
- ↑ 1996 general election results
- ↑ 1998 general election results
- ↑ 2000 general election results
- ↑ 2002 general election results Archived February 3, 2009, at the Wayback Machine.
- ↑ 2004 general election results
- ↑ 2006 general election results Archived November 27, 2008, at the Wayback Machine.
- ↑ 2008 general election results
- ↑ 2008 general election results
External links
- GovTrack.us: California's 2nd congressional district
- RAND California Election Returns: District Definitions (out of date)
- California Voter Foundation map - CD02 (out of date)
Coordinates: 40°12′N 123°30′W / 40.2°N 123.5°W